Traps
Though we have learned several common chart patterns like Double Tops and Double Bottoms. Symmetrical Triangles etc. which are found not only in Point and Figure Charts but also other chart types like Candlesticks, Bar charts etc.
In this section let us learn some unique chart patterns that are found in only Point and Figure Charts.
First let us start with ‘Traps’.
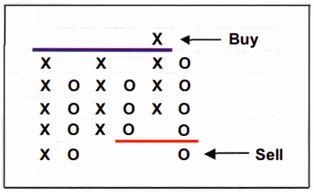
A trap is a pattern which breaks out as expected, but then reverses back into the pattern and breaks out the other side. There is no way to avoid them. They will occur and anyone can get caught in that. The important thing to note is the point at which one should realize that your initial signal has not worked. We cannot assume that any pullback into the pattern after a breakout is a failure, because that's exactly what a 3-box catapult is. In fact, traps are really just failed catapults.
Bull trap
If we act on a triple-top buy signal and the price then pulls back into the pattern, we must not quit the position because a 3-box catapult may be building. In fact, we should remain with your initial signal until there is a double-bottom sell signal.

Bull trap: triple-top buy becomes double-bottom sell.
Bear trap
A bear trap is the opposite of a bull trap. There must be a bottom sell signal, which is then reversed into a top buy signal.


