Cyclical Investing
Introduction to Cyclical Investing
"The fact that the cyclical game is a game of anticipation makes it twice as hard to make money in this basket. The principal danger is that you hop too early, then get discouraged and sell. It's perilous to invest in a cyclical stock without having a working knowledge of the industry "
- Peter Lynch, author of the best-selling book One up on Wall Street
Cycles are nothing new to human life. The first allusion to economic cycles goes way beyond the history of Fiat Money or Stock Markets. It was on the battlefield of Kurukshetra, Lord Krishna introduced mankind to the Eternal Cycle of Samsara- life, death, and rebirth.
No, this module does not contain any more mythological references and from here on we'll be discussing Cyclicals straight-up. Market pundits assume the tulipmania crisis (circa early to mid-1600s) in erstwhile Holland to be the earliest specimen of a market bubble.
Let's dig a little deeper into this topic to understand the nuances of market cycles:
Back in the early 17th century, Tulips were considered a status symbol for Netherlands' rapidly growing affluent class. A man without a collection of tulips was disregarded and considered to be poor in taste. There was a rage and the prices of tulips started climbing gradually.
Soon, Flower peddlers were faced with a new problem. The demand for tulip bulbs far exceeded its supply. Other neighboring countries were also a part of this frenzy and the bubble reached its peak by 1634. Prices soared and reached unprecedented levels. It is said that the most expensive of tulips cost as much as a posh villa in Ireland. The tulips as such did not have any inherent value. Yet, more and more people joined the trade based on the simple notion that someone else would be willing to pay a higher price for the same set of tulips. In essence, they believed that prices could only go up (The Greater Fool Theory)
Simple, isn't it?
Most of the trades were highly leveraged using derivative contracts which exacerbated speculation. And just how every bubble is bound to get burst, this too met its fate when one of the market participants defaulted on their contracts at a public auction. Panic spread and prices started to fall. Many were forced to liquidate their positions and declared bankruptcy.
Although there has been widespread debate about the extent of the tulip crisis, the basic recipe for disaster is the same in almost all cases. The Dot-com bubble, Great Financial Crisis of 2007-08, and maybe even Bitcoin in the near future.
" Is bitcoin really tulipmania 2.0? " is a topic of discussion for some other day. For now, the key lesson to draw home is that when euphoria sets in, it's always wise to take some money off the table. But how do we know when euphoria will set in?
To answer this question- we will have to understand the different stages of a market cycle that we will learn in the next section.
The 4 stages of Market Cycles
Economic activity is not linear; it is cyclical in nature. Periods of expansion in economic activity are followed by periods of contraction and similarly, periods of contraction are followed by periods of expansion. Periods of economic expansion are characterized by rising corporate profits and business optimism. On the other hand, periods of contraction are witness to poor business sentiments and falling profits.
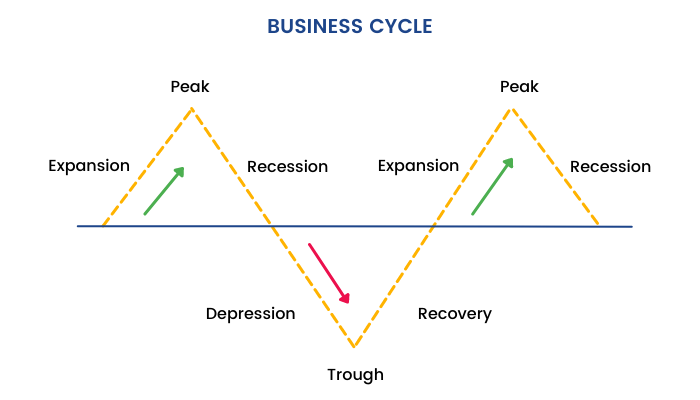
A typical market cycle begins with a period of expansion which can also be looked upon as a recovery from the previous bust. This gradual growth (boom period) phase manifests into madness and the cycle hits its peak. As a result, the economy cools, stock markets fall and there is rampant pessimism (contraction). Eventually, doom gives way to hope, the market reaches a trough and the cycle starts all over again with another period of economic expansion.
An important point to notice in the above graph is the long-term trend of GDP. It is steadily rising upwards when viewed on a larger time frame. This is an important point to keep in mind for an investor when the market is on a downward trajectory. It certainly is scary to see red flashing all over the screen but one must be patient and marquee names in times of distress. Another way to interpret the same picture is that the stock market and the real economy are often in disconnect with each other. And yes, it is most of the time!
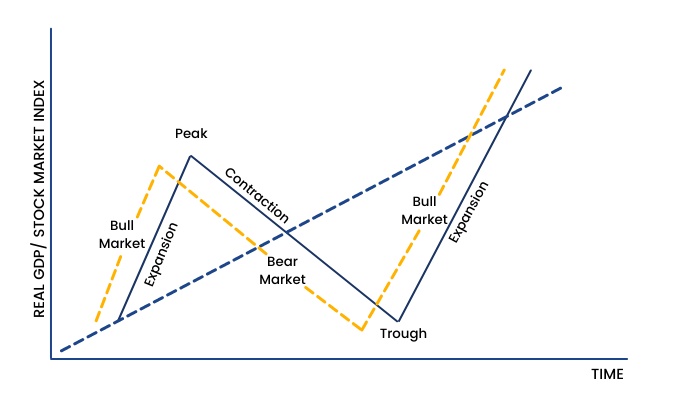
Lastly, the above graph is an oversimplified portrayal of an economic cycle. The market prices will not reflect such linear movements. During periods of expansion, the markets will not trend upwards in a straight line. Instead, periods of expansion will witness many days of across the board selling. Likewise, it would be unfair to expect lower circuits all the way to the market bottom during periods of contraction.
As an educator with India's best stock market platform, I get to interact with a lot of like-minded people. I often come across questions such as:
How can the markets run up so much when the actual economy is on tenterhooks?
Markets have fallen way too much. How can you justify this move?
Always remember, the market is smarter than the smartest of us. The prices today do not reflect market expectations for the current financial year. The market takes into account one year forward expected earnings. There is a new equilibrium price every second as material information gets reflected in stock prices. This explains why there is significant movement in stock on its results day. A new equilibrium price is agreed upon, based on the revision of earnings forecasts. The exchange acts as a platform for price discovery and allows market participants to quote a bid/ask rate of their choice.
The turning points in the business cycle are extremely important from an investor's viewpoint. Investors who possess the skill to anticipate cyclical swings can make a fortune in the market.In order to develop such skills, we must learn what causes a change in the business cycle.
Causes behind business cycles
Earlier, we learned about the four stages of a business cycle. But what are the causes behind such business cycles? So, let us understand.
What are the causes behind business cycles?
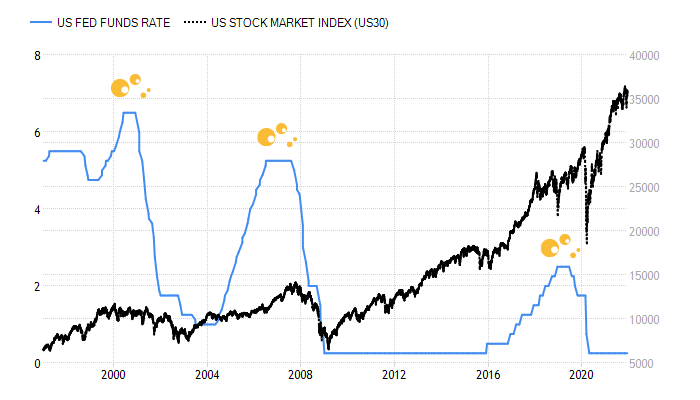
1) Monetary policy -The interest rate cycle is very closely linked to the economic cycle.
- If the economy is on a strong footing and inflationary pressures persist- Central banks will increase interest rates to slow down the pace of growth and keep inflation in check.
- If the economy enters into recession mode coupled with rising unemployment- Central banks will decrease interest rates to spur lending and boost economic growth.
Interest Rates Vs Stock Market
India Story
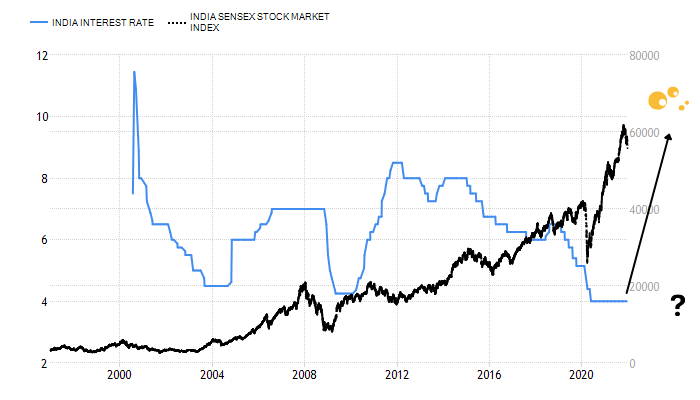
Changes in the level of interest rates are negatively correlated to consumer spending and economic growth. Empirical evidence shows that many bubbles burst when central banks raised interest rates in order to prevent the economy from ' overheating'.
Things were a little different before 1971 when the US Dollar was pegged to the Gold Standard. The gold standard was a monetary system in which each country's currency was valued against a fixed amount of gold. One could simply walk into any bank and convert their gold for US Dollars at a fixed rate. During the early 20th century, one ounce of gold cost $20.67 in the USA. The gold standard provided stability to currency values and hence promoted trade and investment. President Richard Nixon abolished the Gold Standard in 1971 and since then major currencies began freely trading on exchanges.
Today, fiat currency is backed by nothing more than belief. The belief that the currency note can be traded for goods and services. Yes, you heard it right!
The USA has Gold Reserves of 8000 metric tons approximating $500bn dollars in value stored safely at Fort Knox, Kentucky. The number of outstanding dollar bills amounts to $2.02 trillion. That's roughly 4 times. And wait, this number does not include bank deposits or other forms of wealth such as equities, real estate, and so on. Simply put, there are not enough gold reserves to honor every currency note in circulation.
In essence, there is no upper ceiling to the amount of currency a central bank can print.
The modern monetary theory is directly held responsible for significantly reducing the length of economic cycles. Two crisis periods in recent memory - The Lehman Crisis and the Coronavirus crash reiterated the role of central banks in reviving the battered economy. The Federal Reserve cut interest rates to near-zero on both occasions. The Fed responded to the 2008 crisis with emergency measures such as Primary Dealers Credit Facility (PDCF), Troubled Asset Relief Program (TARP), Bailouts of Fannie Mae, Freddie Mac, and AIG, and so on. In totality, it was a $1 trillion-dollar relief package.
It still took more than 2 years to get the economy on its feet
In 2020, this process was even more swift. In less than six months of the crisis, both Nasdaq and Nifty had well surpassed their previous peaks. Although we do not have the final stimulus figures as of yet, A $900 billion dollar stimulus plan has already been approved and a $1.9 trillion dollar package has been announced by President Joe Biden. Such unprecedented Liquidity has propelled asset prices to skyrocket.
A fictional ' fed put' has been created to arrest every single percentage drop in prices. It's the same story everywhere- BoJ, BoE, ECB, SNB, and our very own RBI as well.
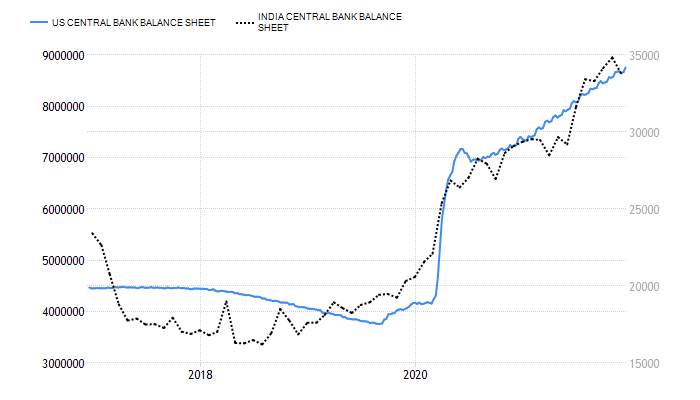
Notice how Central Bank balance sheets have swelled post-March 2020. Money is sloshing around and as a result, we had the shortest bear market on record lasting less than 33 days precisely. The jury unanimously declares that central banks have maximum firepower to influence the length, depth, and quality of market cycles.
2) Supply & Demand- The increase/decrease in supply & demand is both a cause and an effect of economic cycles. Let us view this point against the backdrop of the 2008 Financial Crisis. Housing prices were on a tear since the early 2000's fuelled primarily by low-interest rates and subprime lending. The economy expanded at an average pace of 3% between 2002-06 Next in line- housing prices peaked, demand fell, customers started to default, increasing foreclosures, huge supply glut and the rest is history.
3) Government spending & Macro-economic policies - Tax cuts along with increased government spending boost aggregate demand. Similarly, an increase in taxes with reduced government expenditure will lead to a fall in aggregate demand. Also, the government can artificially influence demand in a particular sector by increasing/decreasing taxes, announcing favorable policies, providing various incentives, giving subsidies, etc.
Export-oriented industries are also prone to macro-economic policies announced by other countries. For instance, a protectionist regime in the USA might deal a significant blow to the Indian Pharma Industry.
4) Technology shocks - Hot news today is stale news tomorrow. Companies that do not make a constant effort to redevelop themselves become a thing of the past in no time. These companies were the poster-boys of revolution at one point in time but today intense competition has left them battered and bruised- Yahoo Inc, Nokia, Blackberry, Xerox, Walkman, Compaq, Polaroid, Canon, Kodak, and so on. The list of such market stalwarts is endless. Moserbaer is one company I recall in the Indian context.
5) Human Behavior- One cannot truly understand market cycles without studying the many psychological elements at play in behavioral economics. Greed and fear are two sides of the same coin and have been known to aggravate economic cycles. Market participants behave in a pro-cyclical manner due to human nature and other cognitive biases that fed the booms and intensified the busts.
Having learned about the different causes behind the business cycle, it remains unclear how we can predict the peaks and valleys of an economic cycle. In the next unit, We will be talking about the different indicators that help us to predict.
Indicators of Boom-and-Bust Cycles
What are the various indicators of the Economic cycles?
Many high-frequency indicators can act as a useful predictor of market cycles. Some commonly used gauges in India include:
- GDP Numbers
- Index of Industrial Production data
- Core Industries growth
- PMI Composite
- Bank Credit Growth
- Import Export Data
- Interest Rate Trajectory
- Corporate profitability
- Peak Power Demand
- E-way Bill Generation
- Railway freight traffic
- Diesel & Petrol consumption
- Tax Receipts - GST Collections
- Passenger Vehicle Sales
- Tractor Sales
- CPI & WPI Inflation
- Steel consumption
None of these measures should be seen in isolation to infer about the state of the economy. These indicators are meant to be surveyed in conjunction with each other in order to arrive at a rational conclusion about the quality of the market cycle.
How should you position yourself?
It is seemingly impossible to call out market tops and bottoms. Instead, one must adopt the pyramiding approach while investing. Add slowly to your total position once the stock starts moving in your favor.
Boom periods- In a structural bull market, one must be overweight on equities. This simply means that suppose you have an overall allocation of 50%-70% of your wealth in equities, then make sure it is closer to the upper end of the range. As a strategy, ride the momentum and do not be in a hurry to book profits. The use of trailing stop losses will help to lock in gains. Passive investors can opt for ETF's or simply go long in futures contracts on the index. Mutual fund investments via the SIP route is also a viable option. Active and seasoned investors may bet on sectoral outperformance/underperformance using ETF's or stock indices.
Bust periods- Tackling bearish market moves are much more difficult than navigating the former. Remember, liquidity is king in a bearish market. Bet on defensives such as FMCG and Pharma. Investors who are anticipating a bearish market ahead must re-allocate a portion of their portfolios to other asset classes such as gold, government bonds and liquid funds. One may also short futures contracts on the Index.
Till now, we have covered all the facts about business cycles, their different stages, and what causes them. Now, we will turn our attention to cyclical stocks, how to analyze them and discuss their exit strategies in the upcoming units of our module.
Cyclical Stocks
What are cyclical stocks?
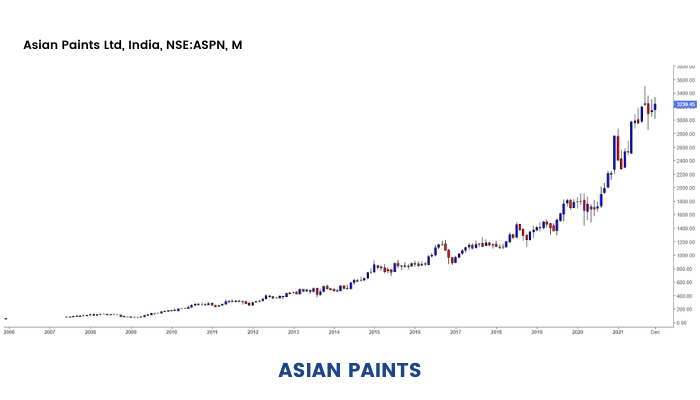
Before I answer this question, Have a look at these two images below-
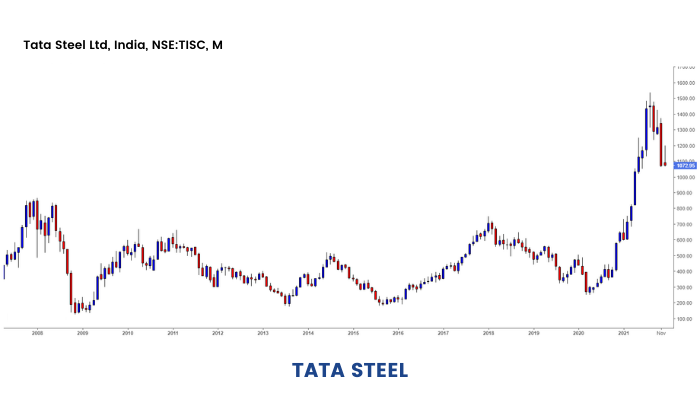
The former price chart is of India's largest steelmaker - Tata Steel
The latter depicts the rise and rise of beautiful homes- Asian Paints
Notice the stark contrast in how both these stocks move. The Tata Steel Stock is nefarious for wild movements on either side. Asian Paints is relatively quiet but has been growing investor wealth consistently.
Well, it's time to pat yourself on the back. You have just learned the easiest way to identify a cyclical stock. And it is the same story universally:
Dealing in Cyclical stocks will give you the same adrenaline rush as riding a Roller-Coaster ride in an amusement park. And needless to say, there is a caution note advising the faint-hearted to stay away.
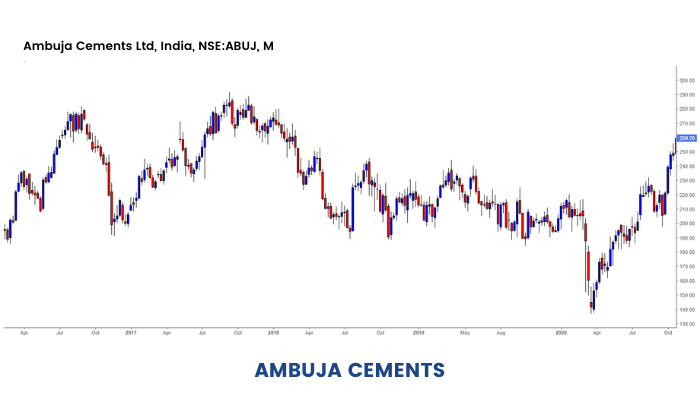
According to Peter Lynch, cyclical stocks are those whose revenues and profits are in tandem with the state of the economy with their performance being tied to the business cycle. These stocks outperform the market during a bull run and underperform when bears take over. Cyclical stocks are vulnerable to the overall state of the economy. Cement, Capital Goods, Construction, Metals, etc. are good examples of cyclical sectors.
Next, let's talk about why choose cyclical stocks?
Why choose cyclicals?
For the simple reason that you might be an adventurous person. Strictly speaking, the bandwidth of gains and losses is much higher in cyclical stocks. It is not uncommon for prices to go up 5x from the bottom to the peak of the cycle.
Let's have a look at how the two stocks we discussed previously have fared in 2020. Tata Steel shed more than half of its market capitalization during the fast and furious correction whereas Asian Paints was much more resilient and went down only by 20%. From their respective 52 week lows, Tata Steel has gone up by a whopping 240% whereas Asian Paints is up a mere 80%.
This data does not intend to say that Tata Steel is a better stock than Asian Paints or vice versa. It just goes to show the point that defensives outperform in a bear market and cyclicals outperform in a bullish market,
The investment mantra to go by-
“The best time to get involved with cyclicals is when the economy is at its weakest, earnings are at their lowest, and public sentiment is at its bleakest"
Peter Lynch
How to Analyze a Cyclical Stock?
Earlier, we discussed the concept of cyclical stocks and why to choose them? However, the question of how to analyze cyclical stocks remains unanswered. Let's get started with it in this unit.
A top-down approach will help you pick a sector ripe for an up move. Next, use a bottom approach to identify a company that ticks all boxes. There are a lot of things to keep in mind while analyzing a potential investment in cyclicals, namely:

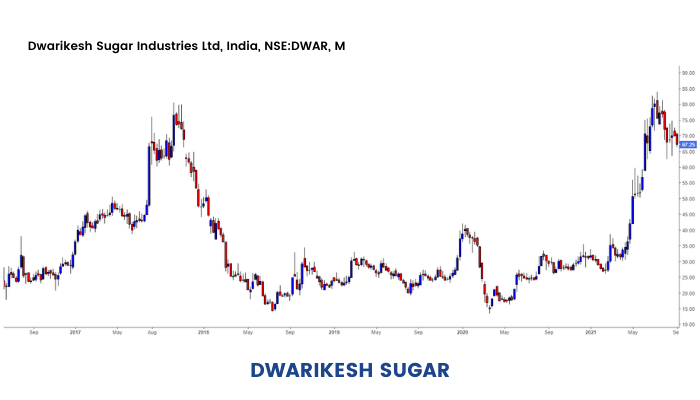
1) Industry dynamics- Jumping into a stock without understanding the industry dynamics is a perilous task. Know the business inside out before you put your money. For instance, I've seen many gullible retail investors buying into sugar stocks with absolutely zero knowledge about the functioning of the industry. The Indian Sugar Industry is highly regulated. It remains virtually paralyzed due to oversupply and is currently hiving off government subsidies. There is no doubt about the fact that the Ethanol policy is a game changer and its proper implementation will be keenly watched.
2) Market positioning- Let us say you have zeroed in on a particular sector. The next logical step is to pick a company that can outperform its peers in terms of returns. Every company may not be adequately positioned to take maximum advantage of the ensuing bull run. For instance, there is a very high divergence in Sales and profitability between North-based & South-based cement companies. Oversupply has long been a bane for the Southern region given the high concentration of limestone reserves (a key raw material in cement production) in the region.
3) Macro-environment- The prospect of some industries is also linked to the overall health of the global economy. Metal stocks are front-runners in market rallies when the macro environment is on a sound footing.
4) Government policies- The Government of India is the only consumer for industries engaged in the manufacturing of fighter jets, missiles, explosives, and the like. Any change in India's foreign policy can have a cascading effect on the fortunes of the defense sector. Similarly, government subsidies act as a lifeline for many industries such as Sugar and Fertilizers.
5) Raw material & finished product prices- One can track the prices of finished products as an indication of strength or weakness. It is important to check three parameters in this regard.
The first thing to check is whether the rise in prices of finished products accompanied by a rise in its cost of production. If the answer to the above question is no, then it is irrelevant. However, if there exists a positive correlation between the two, one must look for companies that are backward-integrated and self-sufficient in raw material production. An integrated player makes a better case for investment since it is protected from price fluctuations.
Secondly, one must analyze the pricing power and demand sensitivity of the company's product portfolio. Let's take up the hypothetical scenario of a Fertilizer company. There has been a significant increase in the price of urea, hiking the overall cost of production for the firm. It may happen that the firm is unable to increase the prices of its products due to cut-throat competition or nascent demand recovery. Hence it is always advisable to look for companies with strong pricing power and brand equity.
A few other pointers to note down:
1) Keep a close watch on inventories & the supply-demand relationship. Watch for new companies entering the market, It is usually a dangerous development.
2) Stocks with a very low Trailing Price to Earnings multiple might indicate the end of the cycle as peak earnings have already been factored in
3) The lower the Price to Book Ratio, the greater is the comfort of ownership
4) Low shareholding of institutional investors is a positive sign.
5) Insider buying and Stock Buybacks are a testimony to the strength of the cycle
6) Check whether the company has a comfortable Debt-Equity ratio of not more than 1:2
Exit Strategy
Now that we have learned to analyze cyclical stocks and supposedly we might invest. But in stock investing, it is vital to have an exit strategy. So, let us elaborate on this topic.
What is the best time to book profits?
By now, you must have realized the importance of timing entry and exits in cyclical stocks. It is not plausible to make money in these stocks by holding them forever. One must exit the investment when the cycle turns against you. Emotional baggage should not influence your buy/sell decisions. Excluding the peak of the cycle, one must also sell a cyclical if:
1)The sector/stock has been hit by a regulatory issue
2) Cost of production is rising faster than Revenue
3) Negative operating cash flows during periods of stellar earnings
4) Existing capacity is insufficient to meet demand and the company has announced additional CAPEX plans
5) There is a buildup in inventories signaling lower prices and lower production in forthcoming quarters
Always be a little skeptical and interpret management commentary during bull markets with a pinch of salt. As the wise men say,
Enjoy the party while it lasts but stay close to the door!
Cyclical Investing for growth stocks
Summarizing what we learned in the last section-
A typical market cycle plays out over a very long-time frame and inoculates with it several mini-cycles on the way along. For example, the Information Technology (IT) sector has been on a super growth cycle since 1991. There were occasional troughs such as during the Lehman crisis as a result of which IT spending was slashed by companies across the board. IT companies were booming before the crisis struck.
For example, IT behemoth TCS reported a 36% CAGR growth in revenues between FY05-08. This halved to 18% during FY11-14 and slid further to 9% in the subsequent three years.

Performance by Infosys was on similar lines. Revenues expanded 27% on a CAGR basis between FY05-08. Growth fell sharply between FY11-14 to a meagre 8% and further to less than 6% in the ensuing three years.

The growth of the Indian IT industry languished for much of the 2010 decade with further headwinds emerging in the form of the Eurozone crisis, Brexit woes, Oil price fluctuations, deglobalization, etc. (The Indian IT industry is export-oriented and hence moves in sync with the global economy. The industry contributes 8% to the Gross Domestic Product of the country and employs about 4.5 million people)
The present-day scenario is in stark contrast to what was earlier anticipated.
The IT industry has once again risen to prominence owing to the digital shift of brick-and-mortar giants after the pandemic. Even the stubbornest minds of all have embraced the need for going digital. Rajesh Gopinathan, CEO, TCS has termed the revival in demand as the start of a multi-year growth cycle.
And the stocks have already run-up in anticipation of the same. The moves have been stellar across both Largecap & Midcap IT. Name the stock and most probably it has just hit a new all-time high.
Do not get the wrong impression here that IT is a cyclical sector. The above illustration just goes on to show the importance of timing the market cycles even in the case of perennial growth stocks.
Another case in point is automobiles. In mature markets like those of the USA and Europe- Automobiles are regarded as cyclical stocks because the end-user markets for these products in these countries have saturated. Of course, companies like Tesla do not fall into this category as the market for electric vehicles is relatively young and is yet to make deep inroads. Look at the price chart of something like General Motors or Volkswagen Group. All these companies house enviable brands such as Jeep, Chevrolet, Cadillac, Audi, Porsche in their kitty. These brands are a source of envy in the neighborhood. However, the stock prices tell a different tale altogether. None of the stocks have built investor wealth and have languished the broad indices to a large extent.


Nonetheless, the Indian automobile market is young and agile. This can be explained by the massive under penetration - There are only 5.4 motor vehicles in India per 100 inhabitants * This number goes as high as 83.8 in the USA, 78.9 in Australia, 47.1 in the UK, and 19.6 in China.
* excluding motorcycles and two-wheelers, circa 2016, we have assumed a growth rate of 7% for the years 2016-20 for the Indian market.
This explains why we should not look upon automobile stocks as cyclical stocks but as growth stories from the Indian perspective.
Just like the IT sector, the Automobile sector in India is in a super bull cycle and one must make use of any steep correction in these companies as a buying opportunity.
Although, the peaks and troughs for automobile stocks are more severe than that of defensives such as IT, Pharma, and FMCG, yet they make for a solid investment case given the ever-growing consumption of India's rising middle class. Once again, timing is very important and you must press the accelerator when things look dim and valuations are attractive.
Case in point- Maruti Suzuki. The brand is almost synonymous with Indian households and commands a whopping 48.50% market share in the 4 wheeler space as of November 2020. For the uninformed, Maruti Suzuki is a JV formed in 1983 between Maruti Udyog of India and Suzuki Motor Corporation(SMC) of Japan. The parent company SMC owns a 56.37% stake in the JV as per the last available shareholding data. The stock is a consistent compounder and has found flavor with Foreign Institutional Investors. It has grown investor wealth at a 20% CAGR for the last decade.
Between 2011 and 2018, the stock price went up by more than 1000%, touching lifetime highs of ₹9,996 in January 2018. In the subsequent years, growth started to falter and the stock entered into bearish territory. No wonder, the same hot stock has given a -5% CAGR in the past three years.
These negative returns can be explained by a variety of factors including:
- Falling revenues
- India leapfrogging to BS-VI emission norms, skipping BS-V. Cost of production soared due to Regulatory compliances. High R&D spends hit margins.
- Input Cost pressures
- Company's inability to raise prices in a highly competitive market
- High crude oil prices (Negative correlation) during much of 2017-2020.
- Switch to only Petrol portfolio from April 2020
- Loss of market share due to the entry of aggressive Chinese competitors in the SUV space
- Overall economic slowdown
- Focus on EV transition and slow adoption
It's the start of 2021 and things have started looking bright for the company. Multiple tailwinds are aiding this recovery. The recent price hikes announced by the company will augur well for margins given that raw material costs have gone up significantly. Demand has proven to be sticky and sustainable unlike what analysts had penciled. The rise of personal mobility given the COVID situation will also be closely watched. The growth will be slow and gradual given we are not yet out of the woods but the future certainly looks promising
These examples go on to show that the Cyclical Investing approach is constructive even for growth stocks contrary to popular belief that this method works only for value stocks. The super bull cycles will provide you with ample mini bearish cycles on the way. The steps are not much different either- buy the gloom and sell the exuberance. Once you master industry cycles, you'll realize the paid propaganda and hollowness surrounding brokerage reports and credit ratings.
Repeat, Recite, Chant, and Meditate to the mantra -
" India is the only destination across the globe with the potential to grow 10% consistently for the next 10 years " and you will end up discovering a dozen multibaggers each day.
Sectoral Analysis
We have learned about cyclical investing so far. Now, let us make a case study on the sugar industry, which is categorized under the cyclical sector.
Let us discuss the nitty-gritty of the sugar sector in this module:
India is the world's second-largest producer & the largest consumer of Sugar. It is the second largest agro-based industry in India, second only to cotton with annual revenues exceeding 1 lakh crore in SS 2018-19. Around 81% of this revenue was from sugar while by-products contributed 19%. Around 3.5% of the country's population is dependent on it both directly and indirectly for livelihood. The sugar sector in India is highly regulated by the Government. It is a hot topic of discussion in the political landscape of Uttar Pradesh & Maharashtra.
There are two sources of sugar demand in India with direct households contributing 35% to the revenue pie while bulk buyers constitute the other 65%.
Why the buzz around sugarcane?
Sturdy crop - Sugarcane thrives in tropical & subtropical areas with temperatures ranging between 21-27 degrees. Extremely high temperatures are harmful to its growth while low temperature slows its growth. Heavy rainfall results in poor crop i.e. low sugar content (recovery rate)
- Better remuneration - A study by CACP shows that the average yield per hectare of sugarcane is around ₹60,000, over 10 times that of cotton & gram put together. No wonder farmers have not shunned despite years of protests against cane arrears.
- Assured buyer- Each farmer has a tie-up with a sugar mill. The mill cannot shut until every sugarcane in the area is crushed. There is an assured buyer regardless of the output.
- Assured price - The farmer gets a fixed price assured by the central or state government, even if late which is not the case with other crops
- No middlemen- There is no third-party intermediary or ' dalal' involved in the purchase & sale of sugarcane. All payments are made directly to the farmers.
Sugar Production process:
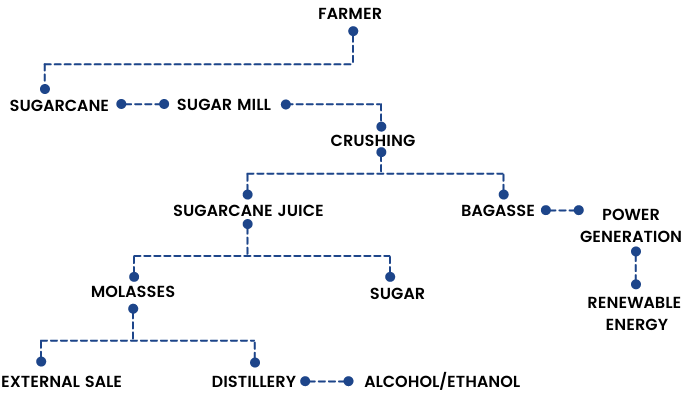
Sugar is extracted from sugarcane. The Sugar extraction process yields various by-products which also can be sold/processed for an additional source of revenue. Baggage which is the crushed residue of sugarcane is used either for paper production or power generation. The total installed cogeneration capacity in all sugar mills is about 4200 MW, of which about 3200 MW is being exported to the grid.
Molasses is another key by-product that is used in the production of Chemical Alcohol or Portable Alcohol (liquor). It is also used in making Ethanol for fuel blending purposes.
1 tonne of sugarcane gives about 110 kg of sugar (at 11% recovery rate), 45 kg molasses (18kg TFS), and 10.8 liters of ethanol.
Global Sugar Industry:
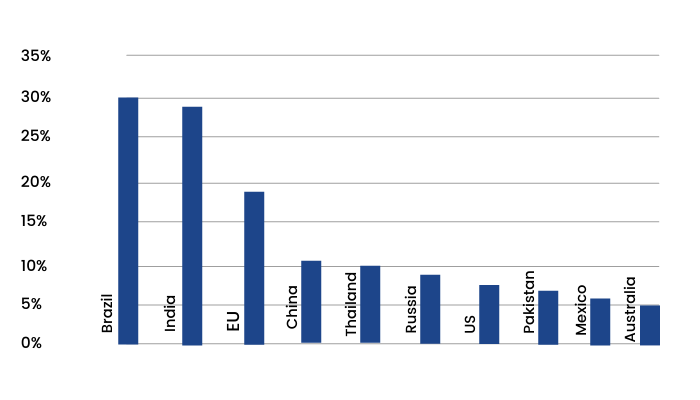
Top 10 sugar-producing countries in 2019-20 (in million metric tons) :
Global 2020/21 Sugar Production is estimated higher USA, India and Brazil up 10 to 40 %
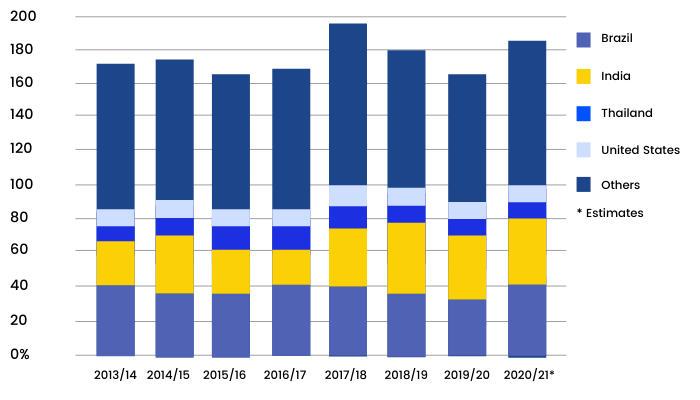
The top 5 countries account for 57% of the total sugar production globally.
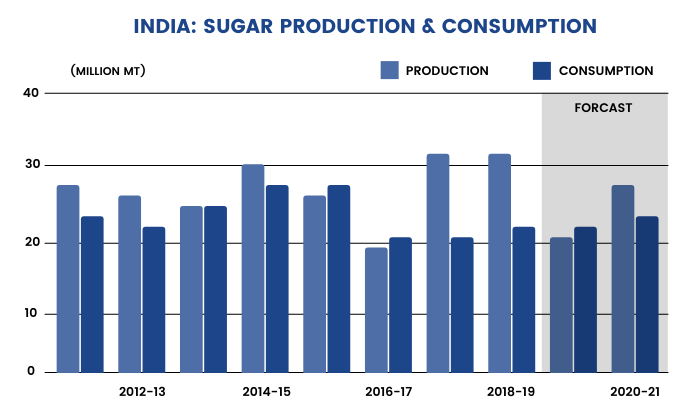
The global sugar industry is staring at a supply deficit in 2020-21. According to estimates by The International Sugar Organization (ISO), Global sugar consumption is expected to be around 175mn tonnes against an output of 171mn tonnes.
International sugar prices are still recovering from a 10-year low of 9.19 cents per pound during the 2020 market crash and are currently hovering around 15 cents a pound at the onset of 2021.
Brazil- contributing around roughly 20% of the world's sugar output might see a dip in production in 2020-21 due to drier weather conditions & firm crude oil prices. Indian production is expected to rebound given high yields & increased sowing area. Thailand at 9% of the total output is also facing dry weather & may plant less this year. The EU is set to record a fall in production for the third consecutive year due to reduced acreage & high incidence of viral diseases. Demand on the other hand is expected to be more or less flat compared to 2019-20.
The India Factor:
Indian sugar Industry at a glance:
- World's largest consumer of sugar at 26 mn tons per annum (muted demand)
- World's second-largest producer of sugar at 32 mn tons per annum (SS20-21 ISMA estimates)
- Annual turnover in excess of ₹1 lakh crore
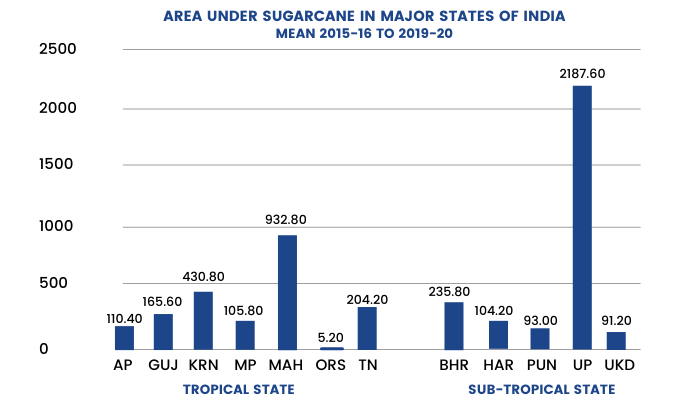
- Around 52 lakh hectares of land area under acreage
- Around 530 sugar mills under operation
- Annual payments of around 85,000 crores to cane farmers
- Per capita consumption at around 20.1 kilos compared to 23.5 kilos globally
- Sugar prices in India trade at a premium of ₹7-8 to their global counterparts.
- The government decides the quantity of sugar to be exported
- Indonesia may emerge to be the largest importer of Indian sugar overtaking Iran
Unsold inventory or opening stock for the current sugar season SS 2019-20 is at an all-time high of 14.6 million tonnes. This is partly on account of a higher year on year sugar production in the previous two sugar seasons ( SS 2017-18 & SS 2018-19).
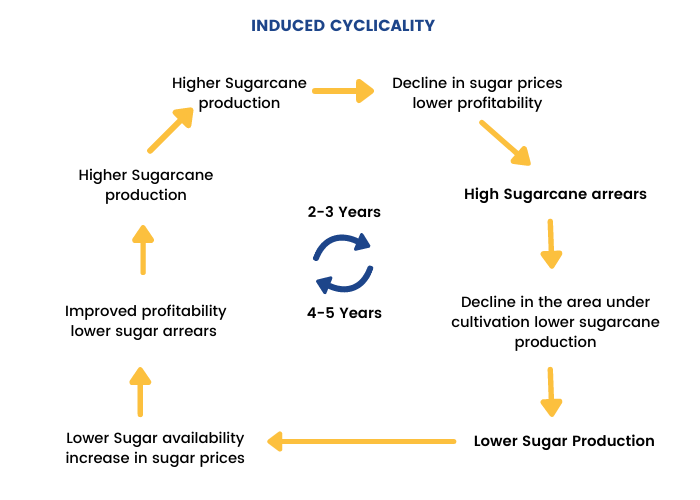
Sugar is a cyclical industry. The demand for sugar in India is more or less stable at 26mn tonnes approximately. One must understand the supply side dynamics in order to predict the sugar realization. It is the supply of sugar that is volatile & causes swings in its price. It depends on the following factors:

No match to global standards:
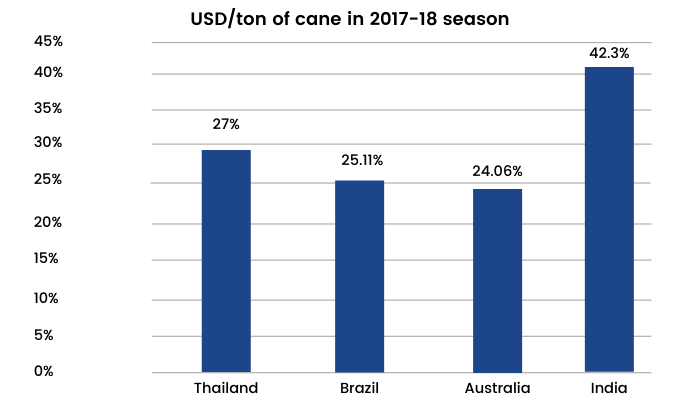
In India, politically sensitive sectors are at the whims and fancies of the ruling party. Indian sugar mills are financially paralyzed and lack modern machinery. It is almost impossible to export Sugar without the support of the government. The current price of cane is well above that of other crops (artificially high prices) which makes Indian sugar uncompetitive in global markets. Remember, International sugar prices trade at a discount. Here is a quick fact check to put things in perspective-Indian sugar mills pay 1.7x for cane than their Brazilian counterparts.
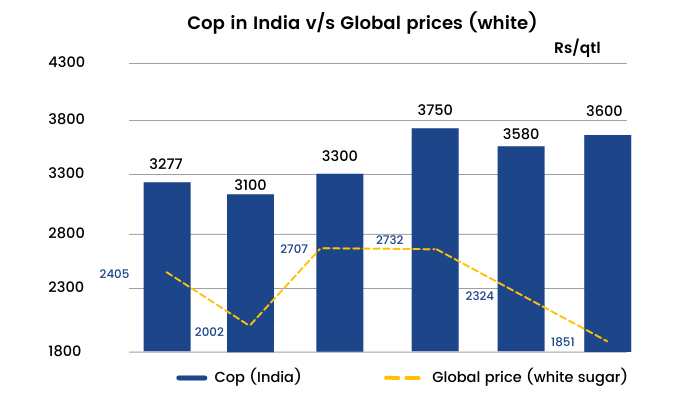
No wonder Indian production costs are much higher than current international prices.
Trends shaping up:
1) Bumper sugar production is here to stay - India has reached a new production threshold above consumption, signalling it will remain a net exporter in the medium term. A combination of various factors can explain the same.
Fixed cane prices support farmers' income. Call it vote bank politics or whatsoever, the price of cane is well above that of alternative crops. This scheme of things has a broader social objective that goes beyond the rationale of markets. Combine this with fixed minimum sugar prices way above international levels, the sugar acreage will be high & immune to price signals from the global markets.
Indian millers are bound by law to crush all cane in their region. This guarantees farmers' revenue but puts sugar mills in a fix. Mills have to continue operations even if market prices fall below the cost of production. It is not possible for producers to collude and jointly reduce output in times of excess supply.
High yielding varieties of sugarcane have been introduced in some of the key producing states. The Co 0238 cane variety has created ripples across Uttar Pradesh leading to an even higher inclination of farmers. These gains in production are likely to be maintained as farmers also have a strong incentive to raise yields, given the price dependency on sucrose levels in the cane.
As long as these three factors do not undergo material changes, sugar production will most likely remain above 30mn tons, unless extremely adverse weather conditions hit agricultural yields. ISMA estimates sugar production at 32mn tons for SS2020-21, assuming normal rainfall & other optimum conditions.
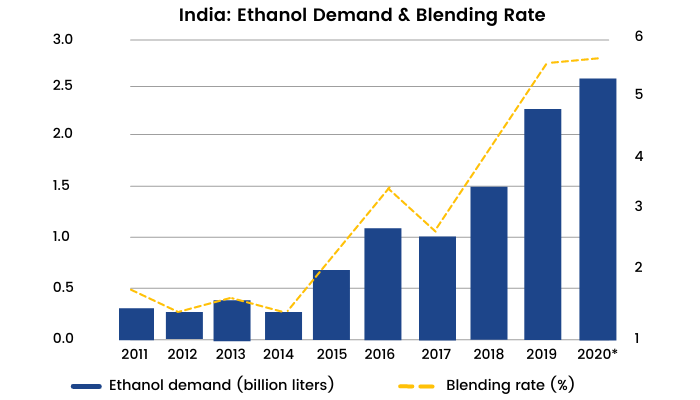
2) Ethanol- the potential game-changer- Ethanol, ethyl alcohol, drinking alcohol, spirits or simply alcohol are one & the same thing. Ethanol is a key by-product for Integrated sugar mills. Ethanol is used for blending along with petrol/diesel to enhance cleaner burning & reducing fuel import.
The NDA government introduced the National Biofuels policy in 2018 which was updated in 2020. The policy intends to achieve 10% ethanol blending by 2022 & 20% ethanol blending with gasoline by 2025 (five years ahead of its previous target). This is signified by the term ' E10' or E20' which means 10% & 20% blending respectively. For SS 2020-21, India plans to have 8.5% blending.
India's current ethanol capacity is at 350 billion liters equivalent to a 7% blending rate roughly. This number underlines the need for rapid capacity addition.
Let us understand the government's agenda behind this move.:
a) Reduction in Import Bill- India is dependent on other countries for around 80% of its crude oil requirements. India imported 226mn tonnes of crude oil worth $112 billion in 2018-19. The E20 regime if implemented successfully can result in annualized savings of around $22 billion. A huge number!
A more moderate assumption of the E10 regime would reduce the sugar production by 4mn tonnes which is also the global sugar surplus today. Undoubtedly, India is the trump card in the sugar pack.
P.S. - Brazil is an ideal benchmark in this regard. The average ethanol blending in the country stands at 48%.
b) Breaking the decades-old jinx-

The government aims to reform the sugar industry as well as avoid damage to its reputation amongst the farmer community. ' The Vibrant Ethanol ' policy strikes both these chords by diverting excess cane to the production of ethanol. The policy would also help sugar mills to diversify their sources of revenue beyond sugar & power generation.
Outlook:
Crawling crude oil prices & lower global output is expected to provide much-needed support to sugar prices. Nonetheless, huge inventories and robust output in the ongoing season coupled with near stagnant domestic demand will cap the price gains.
The biggest problem with regulated sectors is that you cannot predict the changing stance of government policies. This theory has been proved time & again. Renewable energy is one such example in recent memory. One must be very careful while taking any long-term positions in stocks belonging to these sectors. Such sectors are ideal only for short to medium-term investing.
Stock Analysis
After we have learned how to conduct a sectoral analysis of the sugar industry, let us learn how to analyze Balrampur Chini, which is a stock from the sugar industry.
Quick Snapshot: (Data as of Closing Prices on 28th January 2021)

The Kolkata headquartered company generates revenue primarily from three sources: sugar, power cogeneration & distillery operations.
- The company has 10 sugar mills in Uttar Pradesh with an aggregate cane crushing capacity of 76,500 tonnes per day.
- The distillery segment houses 4 units with an aggregate capacity of 520 kilolitres per day.
- The cogeneration business has 8 power units with a total saleable capacity of 165.2 MW after addressing captive needs

Sugar forms the bulk of the revenue pie followed by the distillery & power cogeneration business. The integrated operating profile provides some cushion against the inherent cyclicality in the business.
General discussion:
Balrampur Chini Mills is one of the rare financially sound sugar companies in India. The company is rated AA by Crisil, the highest accorded to any sugar company in the country. The debt equity ratio stands at a comfortable 0.13.
The company has conducted four buybacks in the past five years which provides a lot of assurance about the management integrity. The company has returned more than 1000 crore to shareholders through the medium of buybacks, highest in India's agri sector. The payout ratio is at a healthy 40% on account of consistent dividends & regular buybacks. Promoters own 41.21% in the company as of Q3FY21 & have been gradually increasing their stake.
Let's look at the financial performance of the company in the past 10 years:
Profit & Loss (Consolidated Figures ₹ Crores)

The windfall gains of SS 2016-17
SS 2016-17 was a golden year for sugar stocks, moresofor U.P based companies.
Balrampur Chini Mills reported a record profitability of ₹593 crore during the period. Revenues have risen since then but the company has not yet been able to beat that number. Perhaps all the sugar stocks gave multibagger returns in that bull run going up anywhere between 3-6 times. Balrampur stock was up around 5 times from the trough of the bear cycle.
Here is how things shaped up. There was a drought situation in Maharashtra & Karnataka which forced sugar mills to stop crushing early. As explained in the previous module, sugarcane crop thrives in tropical & subtropical areas with adequate rainfall. Maharashtra cane production halved to 4.5mn tons. Overall production of sugarcane fell 12% to 30.67mn tonnes from 34.84mn tonnes in a year ago period.
At the same time, UP based sugar mills were able to take full advantage of a bumper harvest in the region. Realizations increased and margins jumped exponentially. The same can be seen in the financials of some other names.

The Segmental Breakup:


Look at the impressive growth posted by the company in the distillery segment. It has contributed 62% to the company's H1FY21 EBIT despite being just 16% of the total revenue. Revenues from this segment increased by a mammoth 78% on a YoY basis. This makes it very clear that the ethanol story should be tracked very closely. Any news related to this segment will have a significant bearing on the fundamentals of the stock. According to the management, the next 10 years will be a transition phase to a ' predominantly green energy company '
P.S. - Expect huge capex by the company in this segment going forward. The faster the ramp-up, the better it is.
What impresses us:
We will try to analyze the fundamentals of the company in greater detail.
Despite being in a cyclical industry, the company has reported profits in 18 out of the last 20 years. The company reported profits in all the last 5 years. It is certainly a commendable feat and something to boast about. The company has diversified its revenue streams and aims at further reducing the variability in profits. Robust free cash flow generations are a further icing on the cake.It becomes very important to note that the industry is highly stressed & reeling under ever-burgeoning cane arrears. BCM however paints a completely different picture.
The return ratios are strong, 5-year average ROE stands at 26%, whereas the ROCE stood at 19% as of March 2020. The ROCE is expected to trend upwards given the reduction in Working Capital debt to zero.
The company is in continuous efforts to increase the recovery rates. Growing adoption of high-yielding varieties of cane amongst farmers is pushing up yields for the company. The company reported recovery rates at 11.90% in H1FY21, amongst the highest in the industry. Higher recovery rates lower the cost of production & make the company less susceptible to increase in cane prices or fall in sugar prices.
With 3.14 lakh tonnes of sugar exports in SS 2019-20 and considerable sacrifice of sugar by diverting sugarcane for B heavy ethanol, BCML was able to reduce its sugar inventory by 2.5 lakh tonnes in the past year. The company is sitting on light inventory and can make do without exports in SS 2020-21. As a matter of fact,The Government of India has approved subsidies for the export of 6mn tonnes of sugar for this fiscal against 5mn tonnes in the previous year.
Ethanol prices have been on an upward slope for a long time now. Ethanol prices are announced annually by the The Government of India based on a formula taking sugar & sugarcane prices into consideration. The Government has delinked the price of ethanol from crude oil or petrol prices. Ethanol prices were recently hiked to 62.65/45.69/57.61 from 59.48/43.75/54.27 for Direct Cane Juice/ C-Heavy molasses and B-Heavy Molasses respectively.
The company has been ramping up its distillery capacity at a brisk pace.
- Increased usage of agri-input
- Increased farm mechanization
- Ratoon Management
- More diversified early variety seed usage
- Training field staff
- Management of insects, pests, and disease
The company expects to boost operational efficiencies & scale output at its newly commissioned Gularia facility. Also, BCML has announced a capex of ₹320 crore for setting up an additional 320kl distillery at itsMaizapur Plant. The new capex will be margin accretive & will be operational around November 2022. This will take the total ethanol capacity to 860kl per day. In the longer term horizon, we can expect distillery business with a stable & higher profitability to contribute around 25-30% of the total revenues on a sustained basis.
Outlook:
The fundamentals of Balrampur Chini Mills reaffirm our belief in the sugar story. The integrated nature of the company coupled with strong free cash flow generation make it an excellent portfolio pick.
Conclusion
Summing it all at the end of this module, we have learned all the things that we should keep in mind while investing in cyclical stocks. There are several other modules on ELM School that we have designed for you so that you can learn more about investing, trading, stock markets and more. Be sure to check them out.


