Introduction to Financial Statements
What are Financial Statements?
Financial statements are the medium by which a company discloses information concerning its financial performance. A financial statement of any company is its report card which shows how a company has fared in the last quarter / year and it is the most important aspect of fundamental analysis. It quantifies the company’s performance, strength, liquidity & profitability.
The numbers in a company's financial statements can be bewildering and confusing to many investors. However, if we know how to accurately analyse & interpret them, the financial statements are an ocean of information.
If you can develop a grasp of the definition of the balance sheet and the structure of an income statement, it would help you identify the "red flags" and "gold nuggets" of a company.
Three most important financial statements are:
- Income Statement
- Balance Sheet
- Cash Flow Statement

We will learn to analyze all three financial statements in our upcoming sections of this module, starting with the income statement in the next one.
Analysing Income Statement
Earlier, a brief explanation of financial statements was provided, which consisted of three statements. In this unit, we will start off with the first one, i.e., income statements.
How to Analyse the Income Statement of a Company?
The Income statement is a financial document that measures a company's financial performance over a specific accounting period. Financial performance is assessed by giving a revenue and expenses breakup through both operating and non-operating activities.
The income statement is a document of importance to managers, investors and other stakeholders alike as it contains vital information about the company. The income statement denotes whether a company has incurred profits or losses over a given time period
The different components of an Income Statement are: -
- Revenue
- Other Income
- Expenses
- Net Profit
We will dive through each of these components of income statements in the subsequent units.
Master the A2Z of Finance with our beginner course! Start analyzing income statements for financial success today!
A sample Income statement of Company XYZ:

Revenue
First, let us start with the top line item of the income statement, i.e., 'Revenue.'
Revenue, also commonly known as sales, is generally the most simplistic component of the income statement. It represents the total amount a company has earned during a specific time period as a result of its core business operations. Revenue is also referred to as "the top line" since it is listed at the top of the income statement.
For instance, ABC Corporation produces and sells 100 pens in a year @ ₹ 8/-a piece. The total annual revenues for the company shall be equal to ₹ 800.
Revenues are judged on the basis of their stickiness. Temporary increases, such as those resulting from short-term promotion, are less valuable and should not be treated with high regard.
Markets reward companies that continuously show an increase or growth in revenue every quarter/ year. Companies like Tata Consultancy Services (TCS), HDFC Ltd, Reliance Industries have generated huge shareholders wealth because they have continuously shown growth on their top line front (revenue front).
Investors must also note that cyclical companies (fluctuating revenues) trade at a discount to consistent compounders (steady growth in revenues and net profits).
Click here to know which companies are constantly having increasing revenue.
Following are the two ways in which revenue growth can be achieved:
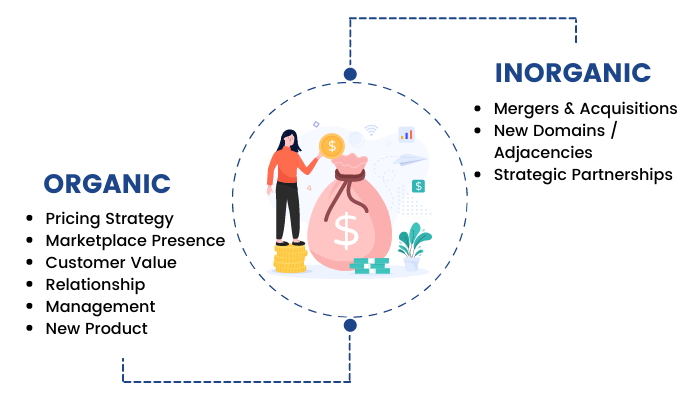
- Organic Growth: It is the growth in a company's revenues & profits which it achieves by increasing output and enhancing sales. This can be done by introducing new products or expanding into other geographies.
Organic Growth excludes any revenues/profits acquired from takeovers, acquisitions or mergers. Takeovers, acquisitions and mergers do not bring about profits generated within the company and therefore, are not considered organic.
Organic growth is the true indicator of the growth of a company, showing how the management utilizes its existing resources to expand its sales. If the revenue growth comes organically then this is highly rewarded by the markets.
- Inorganic Growth: It is the growth in a company's revenue on account of mergers or takeovers rather than an increase in the company's own business activity. Inorganic growth is seen often as a faster way for a company to grow when compared with organic growth. However, the market rewards inorganic growth only when the cost of acquisition or a merger is reasonable. If the former is not true, then the acquiring company is heavily punished for this action.
Corus by Tata Steel, Jaguar Land Rover by Tata Motors, Novelis by Hindalco are some acquisitions in recent corporate history for which the acquirers had to pay dearly, both in terms of operations and share price.
Other Income
Following our discussion of revenue. This section will cover another part of income for a company, i.e., 'Other income.'
Other income generally refers to income earned by a company other than through its common operations. It is income earned through activities rather than core business operations such as gain on disposal of assets, interest income, dividend income, etc.
For example, for a manufacturing firm, interest earned on money invested in bank or equity dividends is an example of "Other Income". However, in the case of financial institutions, interest income is not classified as other income since its core business operation is earning interest on the loans advanced.
Click here to check the other income of a company.

Expenses
Expenses are the costs that a company has to pay in order to generate revenue from its daily business operations. Since we already covered 'Revenue' in our earlier section. Here we will focus on 'Expenses'.
There are many kinds of financial and non-financial expenses that a firm incurs owing to its business operations. Some of the most important ones are discussed below:
- Cost of goods sold (COGS): Cost of goods sold are the direct expenses involved in the production of goods & services. It represents the costs of producing the goods or services sold.
Direct Costs primarily include basic raw material expenses along with the direct labor costs used to produce the goods or services. It excludes indirect expenses such as distribution costs and sales force costs.
For example, the COGS for a steel maker would include the material costs of the minerals that go into making steel like iron ore, coking coal, etc. along with the labour costs used to make the steel. The cost of sending the steel to dealers and the cost of the labour used to sell the steel would be excluded.
Analysts deduct COGS from a company's sales revenue to calculate a profit metric known as gross profits. If the COGS, as a percentage of total sales, increases on a quarter-on-quarter basis, this signifies poor operating performance. It might also signify that the company is unable to undertake price hikes despite rising raw material costs.
COGS is also referred to as “cost of sales”. It is calculated as:
COGS = Opening Inventory + Purchases – Closing Inventory.
COGS, in general, shall be higher for the companies in Steel, Cement or Retail sectors and shall be almost negligible for the companies in the service sectors like IT and Telecom.
- SG&A: SG&A (Selling, General & Administrative Expense) is the sum of all the direct and indirect selling expenses as well as all the general and administrative expenses of a company. These expenses include those of marketing, salaries, utility bills, technology expenses and other general costs associated with running a business. They are incurred as a part of day-to-day business operations.
Direct selling expenses are expenses that can be directly linked to the sale of a specific unit such as credit, warranty and advertising expenses. Indirect selling expenses are expenses which cannot be directly linked to the sale of a specific unit but which are proportionally allocated to all units sold during a certain period such as telephone, interest and postal charges. General and administrative expenses include salaries of non-sales personnel, rent, heat and lights.
SG&A will be higher for the companies in sectors which involve very high marketing expenses. This includes sectors like FMCG, Telecom, etc. and would be comparatively lower for sectors like Steel, Oil Refinery, etc.
High SG&A expenses can be a serious problem for almost any business. Examining this figure as a percentage of sales and comparing it to other companies in the same industry can give some idea of whether management is spending efficiently or wasting valuable cash flow in marketing & sales activities.
- Research & Development Expenses: Research and development are one of the means by which business can experience future growth by developing new products or processes to improve and expand their operations.
A business incurs R&D expense with the intention of making a discovery that can either lead to the development of new products or procedures, or improvement of existing products or procedures. For example, R&D expenses for a Pharma company or for a computer software company could be with an intention to develop a new drug or software, however, for a television company could be with the intention to improve the quality of its old products.
There is a big difference between Research expense and Development expense which is often considered to be one. Research expense is incurred when a firm is spending on research to come up with new product or ideas while development expense is incurred when the firm develops that idea or the initial product into a financially and operationally viable production stream.
From sales we subtract COGS, SG&A and R&D expenses to reach a profit metric called EBITDA (Earnings before Interest, Taxation, Depreciation and Amortization).
EBITDA= Sales + Other Income - (COGS + SG&A + R&D)
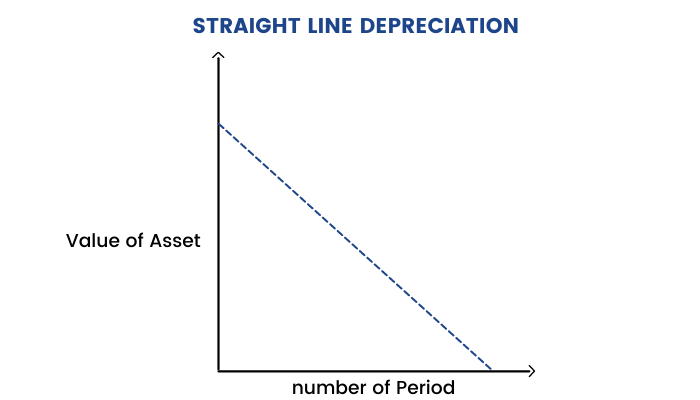
- Depreciation Expenses: Depreciation is a term used in accounting and finance to allocate the cost of a tangible asset over its life span of several years. In simple words we can say that depreciation is the reduction in the value of an asset due to usage, passage of time, wear and tear, technological outdating or obsolescence, depletion, inadequacy, rot, rust, decay or other such factors.
Depreciation is used in accounting to try to match the expense of an asset to the income that the asset helps the company earn. For example, if a company buys a piece of equipment for ₹1 million and expects it to have a useful life of ten years, it would be irrational to expense the total ₹1 million in a single year since the asset will provide the benefit for a period of ten years. Hence, the cost of the asset is appropriated into its entire usable lifetime. Every accounting year, the company shall charge ₹1,00,000 (assuming straight-line depreciation), which will be matched with the money that the equipment helps to make each year.
Depreciation is a non-cash expense; thus, it does not reduce the cash balance of a firm however, it helps in savings of the tax expense since the recording of depreciation will cause an expense to be recognized, thereby lowering stated profits on the income statement.
- Amortization Expenses: Amortization is a term used in accounting and finance to spread the cost of an intangible asset over its lifespan. While amortization and depreciation are often used interchangeably, technically this is an incorrect practice because amortization refers to intangible assets and depreciation refers to tangible assets.
For example, if Reliance Industries purchases software for its operational usage for ₹1 million, every accounting year, the company will expense ₹1,00,000 (assuming straight line depreciation) as amortization expense for every year.
From EBITDA we subtract depreciation and amortization expenses and come to a profit metric called EBIT or operating profit. (Earnings before Interest and Taxes)
EBIT= EBITDA- Depreciation -Amortization expense
- Interest & Tax Expenses: Interest expense is the total cost incurred by the company for using borrowed money. It is generally higher for companies in sectors requiring huge capital expenditure such as Real Estate, Capital Goods, Engineering, etc and is comparatively lower for service sector companies like IT, FMCG, Pharma, etc.
Tax expenses is the amount reported by a company on its income statement as a part of its direct tax payments to the government
The tax expense for the year typically includes the following two elements-
1) Current tax – It is the tax expense that is due for the current year
2) Deferred tax – Deferred tax arises due to the difference in income recognition between the tax laws and the company’s accounting methods.
From EBIT we subtract interest and tax expenses to arrive at the Net Profit.
Net Profit = EBIT- Interest -Taxes
Calculate Depreciation
How to calculate Depreciation?
In the last unit, we briefly discussed the concept of depreciation as part of expenses in the income statement. Here we will learn not only to calculate depreciation expenses but also its different methods.
I.Straight line Method of depreciation- This method is the simplest and commonly used method of depreciation. It is calculated by taking the purchase or acquisition price of an asset, subtracting the salvage value and then dividing by the total productive years for which the asset is expected to benefit the company.
Depreciation = (Cost of an Asset- Salvage Value) / Useful life
Where,
- Cost of the asset is purchase price or historical cost
- Salvage value is value of the asset remaining after its useful life
- Useful life of the asset is the number of years for which an asset is expected to be used by the business
Example: - Consider an asset that costs ₹30,000 with an estimated useful life of 8 years and has a salvage value of ₹5,000. Under the straight-line method, the depreciation expense per year will be
Depreciation expense = (30,000-5,000)/8 = ₹3,125 per year
II.Accelerating Method of Depreciation- This method allows the companies to write off a larger part of assets in the earlier years than the later years. It recognizes higher depreciation expenses during the earlier years as compared to the straight-line method of depreciation. The major benefit is to provide a tax shield. In the initial years, the depreciation is higher as a result of which tax charged on the profit is less compared to the later years. This results in deferment of tax liability since income in earlier years are lower.
There are two most popular methods of Accelerated Depreciation Methods-
A)Double Declining Method – In this method, a fixed rate of depreciation is charged on the net value of the fixed asset at the beginning of the year. The rate of depreciation charged under this method is twice the rate that is charged under the straight-line method. The method reflects that assets are more productive in the earlier years as compared to their later years.
Depreciation Expense = 2 x Straight-line depreciation rate x Book value at the beginning of the year.
Example: - Consider a piece of property, plant, and equipment (PP&E) that costs ₹25,000, with an estimated useful life of 8 years and a ₹2,500 salvage value. To calculate the double-declining balance depreciation, set up a schedule:

B)Sum of the Years’ Digits Method – In this method, the remaining useful life of the asset in a particular period is divided by the sum of the years’ digits. This fraction is then multiplied by Depreciable Cost. It recognizes depreciation at an accelerated rate.
Depreciation Expense = Depreciable Cost x (Remaining useful life of an asset/Sum of Years’ Digits)
Where,
Depreciable Cost = Cost of asset – Salvage Value
Sum of Years’ Digit = n x (n+1) / 2
where n = useful life of asset
Example: - Consider a piece of equipment that costs ₹25,000 and has an estimated useful life of 8 years and a ₹0 salvage value. To calculate the sum-of-the-years-digits depreciation, set up a schedule:

III.Unit of production Method of Depreciation- This method provides for depreciation by means of a fixed rate per unit of production. The units-of production depreciation method depreciates assets based on the total number of units to be produced by using the asset, over its useful life.
Depreciation Expense = (Number of units produced / Life in number of units) X (Total Acquisition Cost - Salvage Value)
Example: - Consider a machine that costs ₹50,000, with an estimated total unit production of ₹100 million and ₹10,000 salvage value. During the first quarter, the machine produced 5 million units.
Depreciation Expense = (5/100) x (50,000-10,000) = ₹2,000
Net Profit
Net profit is the amount of money that a company earns after deducting all its expenses from its revenue. Previously, we have explained both the revenue & expense. Now in this unit, we will explain 'Net Profit.'
Net profit is also referred to as "the bottom line" since it is listed at the bottom of the income statement.
Regardless of the location, size, market attributes & other tangible/intangible factors, a company’s primary objective remains earning consistent profits. It is so because it is the profit out of which the shareholders of a company are rewarded in the form of dividends, capital appreciation & further re-investment into the business.
A company which is not generating profits for a long period is finally forced to close owing to the market forces because sustaining losses for a prolonged period is not what shareholders want.We divide the Net Profit of a company by the total number of shares outstanding for the period to come up with a metric called EPS (Earnings Per Share).
EPS= Net Profit / No. of shares outstanding.
Basic Proforma of Income Statement
The Basic Proforma of Income statement is as mentioned below:

Analysing a Balance Sheet
After analyzing the income statement next, we will learn how to analyze a company's balance sheet.
How to Analyze the Balance Sheet of a Company?
A Balance Sheet highlights the financial condition of a company. It offers a snapshot of the company's health. It tells us how much a company owns (assets) and how much it owes (liabilities) at a particular period of time. The difference between what it owns and what it owes is its equity also commonly called "net assets" or "shareholders equity".
The balance sheet is named by the fact that it represents a business' financial structure balances in the following manner:
Assets = Liabilities + Shareholders' Equity
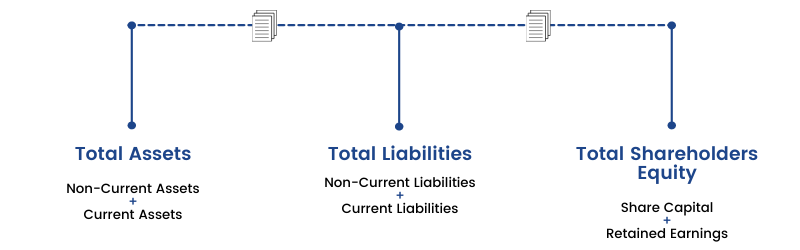
A balance sheet of a company provides the users of financial statements with a lot of critical information. This information can be studied to draw various conclusions about the financial health of a company. Understanding and analysing the balance sheet data is an integral part of financial analysis as a whole. So it is essential to understand assets, liabilities & shareholder's equity. We will describe each of them in the upcoming units of this module.
A sample Balance sheet of company XYZ:

Assets
First, let us begin with explaining the concept of ‘Asset.’
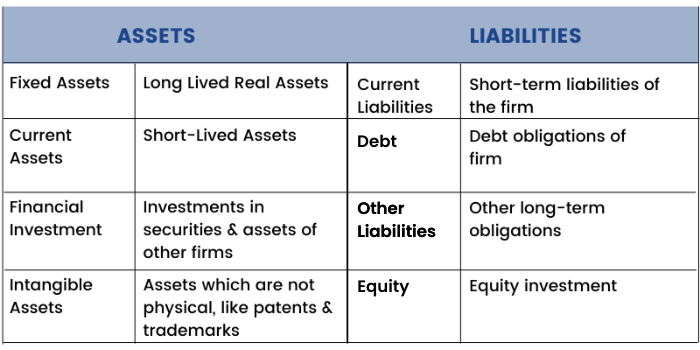
Assets are resources owned/controlled by any economic entity that is expected to provide some future economic benefit. Assets can be created by operating activities (e.g., generating net profit), investing activities (e.g., purchasing manufacturing equipment) and financing activities (e.g., issuing debt).
There are two main types of assets:
- Current assets
- Non-current assets
Current Assets:
Current assets are those assets that can be easily converted into cash or used within one year or one operating cycle, whichever is greater. Four very important current asset items found on the balance sheet are:
- Cash:
Generally, investors are attracted to companies with plenty of cash on their balance sheets. After all, cash offers protection against tough times and it gives companies more options for future growth. Cash is the most liquid current asset.
- Accounts Receivables:
Receivables are outstanding (uncollected bills) amounts owed by customers (individuals or corporations) to a business entity in exchange for goods or services that have been delivered or used but not yet paid for. Receivables usually come in the form of operating lines of credit and are usually due within a relatively short time, ranging from a few days to a year. The accounts receivable is recorded on the asset side of a public company's balance sheet because this represents a legal obligation for the customer to remit cash for its short-term debts.
Analyzing the speed at which a company collects its receivables can tell us a lot about its financial efficiency. The company may be letting customers stretch their credit in order to recognize greater top-line sales and that can spell trouble later on, especially if customers face a cash crunch.
- Inventories:
Inventories are items held for sale or used in the manufacturing of goods to be sold later. Manufacturing firms separately report inventories of raw materials, work-in-progress and finished goods.
Companies have limited funds available to invest in inventory. To generate the cash to pay bills and return a profit, they must sell the merchandise they have purchased from suppliers. Thus, when inventory grows faster than sales it is almost always a sign of deteriorating fundamentals.
Possessing a high amount of inventory for a long period is not usually good for a business because of inventory storage, obsolescence and spoilage costs. However, possessing too little inventory isn't good either because the business runs the risk of losing out on potential sales and potential market share as well.
Investors must keep an eye on the Inventory Turnover Ratio to judge how fast the company is able to convert its inventory to sales. A low turnover ratio might signify slow sales coupled with excessive inventory levels. Similarly, a high ratio might point to fast sales & low inventory levels.
The lower the levels of inventory, the lower the working capital tied to a business.
- Marketable Securities:
Marketable securities are non-strategic debt or equity securities in which the company has invested, that are traded in a public market. They are liquid securities that can be readily converted into cash quickly at a reasonable price. Marketable securities are liquid in nature as they tend to have maturities of less than one year.
Furthermore, the rate at which these securities can be bought or sold has little effect on their prices.
Examples of marketable securities include commercial papers, banker's acceptances, treasury bills, equity investments, amongst others.
Current assets:
(a) Inventories
(b) Biological assets other than bearer plants
(c) Financial assets
- Investments
- Trade receivables
- Cash & cash equivalents
- Other bank balances
- Loans
(d) Other current assets
Non- Current Assets:
Non-current assets can be defined as all those assets that are not expected to be converted into cash in the next financial year. This includes fixed assets such as property, plant and equipment (PP&E). Unless the company is in financial distress and is liquidating assets, investors need not pay too much attention to fixed assets.
Other non-current assets include Intangible assets. Intangible assets are unidentifiable, cannot be purchased separately and may have an infinite life e.g. goodwill. Intangible assets with finite life are amortized every year e.g.software, patents, etc.
Goodwill is seen as an intangible asset on a firm's balance sheet because it is not a physical asset such as building and equipment. Goodwill is the excess of purchase price over the fair value of the identifiable assets and liabilities acquired in a business acquisition.
For example, if company A acquired company B by paying ₹600 million and at the acquisition date the fair value of company B's assets is only ₹560 million then on company A's books, the excess of ₹40 million which is paid will be recorded as goodwill.
Non-current assets:
(a) Property, plant & equipment
(b) Capital work in progress
(c) Goodwill on consolidation
(d) Other intangible assets
(e) Intangible assets under development
(f) Financial assets
- Long term investments
- Investments in associates
- Investments in a joint venture
- Loans
(g) Other non-current assets
Liabilities
We have learned that assets are things that a company owns but liabilities are what a company owes to other parties. Here in this section, we will discuss the concept of 'Liabilities.'
A liability is an obligation or debt of the entity that arises during the course of business operations, the settlement of which is expected to result in an outflow of economic resources of the entity. Like assets, there are two types of liabilities:
- Current Liabilities
- Non-current liabilities
Current Liabilities:
Current liabilities are obligations the firm must pay within the current operating cycle (usually a year) such as payments owing to suppliers, short term debt, accounts payable, etc.
Four important current liabilities items found on the balance sheet are:
- Accounts Payable:
Accounts payable are amounts owed to suppliers for goods or services purchased or availed on credit. Accounts payable are types of debts that must be paid off to the suppliers within a given period of time in order to avoid default and run the business smoothly.
- Notes Payable:
Notes payable are obligations in the form of promissory notes owed to creditors. They can also be included in non-current liabilities, if their maturities are greater than one year.
- Current portion of Long-term debt:
It is the principal portion of long term debt that is due within one operating cycle of the firm or a year, whichever is greater.
- Taxes Payable:
Taxes payable are current taxes that have been recognized in the income statement but are not yet paid.
Current liabilities:
(a) Financial liabilities
- Borrowings
- Trade payable
- Other financial liabilities
(b) Other current liabilities
(c) Provisions
(d) Current Tax liabilities (Net)
Non-Current Liabilities:
It represents those liabilities that are not due in the next operating cycle. Typically, non-current liabilities represent bank and bondholder's debt.
Deferred Tax liabilities, Long-term leases & Pension liabilities are a few other examples of non-current liabilities.
Non-current liabilities:
(a) Financial liabilities
- Borrowings
- Other financial liabilities
(b) Provisions
(c) Deferred tax liabilities (Net)
(d) Other non-current liabilities
Shareholders’ Equity
Shareholder's equity is calculated as total assets minus total liabilities and is also known as Owner's equity or Stockholders equity. Earlier, we explained both assets & liabilities. Now, let us focus on understanding 'Shareholder’s equity.'
This is the net worth of the company aka the stockholder's claim to the assets of the company after all liabilities have been paid off.
It is the initial cash/capital brought into the entity by its owners plus the additional surplus in the form of profits and losses. Shareholders’ Equity can be divided into sub-parts such as securities premium, reserve fund and retained earnings.
- Authorized Capital
The maximum amount of share capital that a company is authorized to issue according to its Articles of Association is called the authorized share capital of the company. The amount of authorized capital is always measured at par value (face value) and can be increased through an ordinary resolution approved by the company’s shareholders provided it is permitted in the articles of association.
Similarly, authorized capital can also be reduced. This is known as diminution of share capital.
- Issued Share or Paid-up Capital
The issued share capital is that part of the authorized capital that has been issued by the company. The difference between the authorized and issued share capital is the part which the company can further raise from the public without passing any further approval by the shareholders.
- Reserves & Surplus
Reserves are funds set aside by the company for unforeseen future obligations. The company can use the general reserve for various purposes including issue of bonus shares to shareholders, payment of dividends when profits are insufficient.
Excess profits in the Profit & Loss Account are distributed as dividends, re-invested in the business or transferred to the general reserves.
The company can park its excess funds in the following reserves:
1) General Reserve
It is a reserve created by transferring profit's which remain undistributed over the year after accounting for dividends and other deductions. This reserve is used for funding expansion, acquisition, paying dividends, discharging of liabilities, writing off extraordinary and/or contingent losses, buyback and/or redemption of securities
2) Share Premium Account
This account includes the amount which is transferred "from the excess value at which the shares of the company are issued over and above its face value” during the public issues. The amount can be used for buybacks, bonus issues or to write off discounts on further issues of shares.
3) Capital Reserve
Capital reserve represents surpluses or profit in respect to transactions on account of revaluation of assets or forfeiture of shares. It is not a free reserve and includes share premium, capital redemption reserve, development rebate reserve, profits on reissued or fortified shares and also includes any grants received from central or state government or other assets gifted by central or state governments free of cost.
Analysing the Cash Flow Statement
Previously, we have completed explaining how to analyze income statements & balance sheets. Lastly, we will learn to analyze the cash flow statements of a company.
How to Analyse the Cash Flow Statement of a Company?
Cash Flow statement is a document that provides aggregate data regarding all cash inflows of a company from both its ongoing operations and external investment sources and all cash outflows on account of business activities and investments during a given quarter or year.
A cash flow statement shows the cash or liquidity position of a company.
It provides information regarding the following:
- Company's cash receipts and cash payments during an accounting period
- Information about the company's operating, investing and financing activities
- An understanding of the impact of accrual accounting events on cash flows
As an analyst, one should use the cash flow statement to determine whether or not:
- Regular operations generate enough cash to sustain the business
- Enough cash is generated to pay off existing debts as they mature
- The firm is likely to need additional financing
- Unexpected obligations can be met
- The firm can take advantage of new business opportunities as they arise
Companies generate and exhaust cash in several ways, hence, the cash flow statement is divided into three sections: cash flows from operations, financing and investing.
Cash Flows from Operating Activities:
This includes transactions from all the core or operational activities of a business. It shows how much cash comes from sales of the company's goods and services, less the amount of cash needed to produce and distribute those goods and services.
Companies that manage their working capital requirements efficiently, manage to generate positive cash from operations. This helps them to plan for Capex or Acquisitions for future wealth creation.
Example of cash flows from operating activities:.

Cash Flows from Investing Activities:
This section largely reflects the amount of cash the company has spent on capital expenditures, such as new equipment or anything else needed to keep the business going. It also includes acquisitions of other businesses and monetary investments. It shows the cash flows that arise from investing gains or losses. It also provides information on changes in the company’s capital expenditure (CAPEX). If Cash Flow from Investing Activities is negative it signifies that the company is on an expansion spree & investing in the business.
Example of cash flows from investing activities:

Note: Interest received can be included under cash flows from interest activities or financing activities.
Cash Flows from Financing Activities:
This section details the cash flows associated with external financing activities. Sources of cash inflow would be cash raised by selling stock and bonds or by bank borrowings.
Likewise, paying back a bank loan would show up as an outflow and so would dividend payments & common stock repurchases.
Example of cash flows from operating activities:

The above examples are discussed keeping in mind the normal business activities of a manufacturing firm.
However, for a bank the definitions would change a little. For example, in the case of a manufacturing firm, interest income is not its operating or core business income hence it is a part of cash flow from financing activities.
Nevertheless, for a bank, interest income is a part of its core business operations and hence it forms a part of cash flow from operations.
The Effect of Secure Payments and Cash Flow:
Every smart business owner, accountant and entrepreneur will tell you that the key to a healthy cash flow is good relationships with clients and secure payment methods. When these two elements co-operate hand in hand, you can be sure that you’ll be in the best possible place to keep your business in the green. In the modern day, there are numerous convenient ways to send money and receive payments, especially if you’re dealing with international stakeholders regularly. By tracking payments online and using a secure app, you can be sure that your finances are always being handled in the most professional way. If you notice dips in your cash flow, now might be the perfect time to assess your payment processes and switch to a more secure and reliable method in the future.
A sample Cash flow statement of Company XYZ:

Consolidated Vs Standalone Statements
Though we have completed understanding a company's financial statements and their components, a company has to publish its financial statements in two ways: standalone basis and consolidated basis. So in this section, let us understand each of them and their differences.
What are Standalone Financial Statements?
Standalone financials represents the financial statement of the entity as a single company without taking into consideration its subsidiaries/associates.
By only analysing the standalone financials, an investor shall not be able to form a holistic/accurate outlook on the company.
For instance, the parent company might be a debt free company but the subsidiaries of that company may be heavily indebted. Such crucial information is bound to slip the eye when we someone pays too much attention to standalone financials.
What are Consolidated Financial Statements?
Consolidated financial represents the financial position of the company as a whole i.e. the parent along with its subsidiaries & associates.
By analysing the consolidated financial statement, the investor gets a broader outlook about the company, thus helping the investor to make an informed decision.
For instance, the heavy debt in the books of the subsidiary which slipped the eye while analysing the standalone financials of the parent company could be identified while analysing the consolidated statements.
Consolidated Statement vs Standalone Statement
Since the parent company along with its subsidiaries form a single economic entity, investors, regulators, and customers find consolidated financial statements more beneficial to gauge the overall position of the company.
For instance,
- The parent and the subsidiary perform transactions among them as if they are unrelated. An automaker for example, might own the company that makes its transmissions but still pays that company for the transmissions it provides.
- The parent company supports the subsidiary during struggling times in a hope to recover the amount paid to the subsidiary from its operation.
Transactions of this nature shall appear on standalone financial statements because they affect the profitability of the standalone units. However, such transactions do not appear on consolidated statements because they don’t affect the overall nature of the parent company.
- When a parent owns stock in a subsidiary, the stock has different treatment in the books of parent and subsidiary, the stock appears as an asset on the parent’s standalone balance sheet but as equity on the subsidiary’s balance sheet.
- When the parent purchases something from the subsidiary or vice versa, each account for the transaction to be shown separately on its cash flow or income statements. If one party lends money to the other, the treatment is different from both perspectives; the loan is an asset on the lender's balance sheet and a liability on the borrowers.
- During consolidation, intra company transactions will be eliminated to avoid double recording of the transactions.
- The listed companies do not disclose detailed financial positions of their unlisted subsidiaries in the annual report. Therefore, to find out the utilization of cash or investment made by the subsidiary companies, an investor needs to compare the standalone and consolidated financials.
Financial Statements – Case Study
To compare standalone and consolidated financial statements, let’s assume XYZ Corporation Ltd. Is a holding company and does not have any other business operation of its own.
Dividend income received from its numerous subsidiaries is the only source of income for the company.
Further, let us assume that all the subsidiaries of ABC Ltd. are making huge losses.
But sometimes the subsidiaries survive by taking loans from banks and use these loans to declare dividends for its shareholders like XYZ Ltd.
In such a situation, while analysing XYZ Ltd, an investor considers only the standalone financials of XYZ Ltd.
- Then it will be found that XYZ Ltd. has very little debt and is showing profits due to the dividend received from its investments in its subsidiaries.
- However, if the investor analyses the consolidated financials of XYZ Ltd, then they would immediately come to know that XYZ Ltd. (as a group including its subsidiaries) is making huge losses and has substantial outstanding loans
- The investor would immediately become aware of the problems being faced by XYZ Ltd.
- Therefore, after analysing consolidated financials of XYZ Ltd, the investor may take a better-informed investment decision.
Which Financial statements should be used for analysis?
From the above understanding of the consolidated and standalone financial statements, we could conclude that analysing the consolidated financial statement is way better than analysing the standalone financial statement.
In analysing the consolidated financials, the investor is well informed about all the transactions and information which might be missing in analysing the respective standalone financials.
For instance, a capital structure that prima facie looks clean on the parent book after analysing and can be accurately captured by taking into account its heavily indebted subsidiaries as evident from the consolidated financials.
Comparative analysis of EBITDA
Company: Tata Motors Ltd
Below are the quarterly financials of Tata Motors Ltd both consolidated and standalone.
Analyse the EBITDA in the both the financials below:-
Consolidated Basis:

Standalone Basis:

- By analysing the EBITDA from both standalone and consolidated basis, we derive that the major portion of the EBIDTA are from the subsidiaries.
- The company’s standalone EBIDTA makes up a very small portion of the consolidated EBIDTA and hence any major changes in the subsidiaries in any aspect shall have a large impact on the group as a whole.
- Therefore, for making any decisions regarding this company, a close watch needs to be kept on its subsidiary’s operations as they are sizable in nature.
Comparative analysis of Trade Receivables
Company: Tata Motors Ltd
Now let us analyse the Trade Receivables of Tata Motors for both standalone and consolidated basis for the year ended 31/03/2021.
Standalone Basis:

Consolidated Basis:

- We need to analyse the trade receivables using both standalone and consolidated financials.
- The reason being, the transaction between the parent and the subsidiary shall be nullified in the consolidated financials.
- This implies that the company needs to analyse the subsidiary’s receivables carefully because they make up a major portion and any default on their end shall affect the parent company or vice-versa.
- Hence, this will help in knowing the quantum of receivables between parent and subsidiary.
- This can be noticed by the investor only if they analyse both the standalone and consolidated financials of the company.
Comparative analysis of P/E for the quarter ended 31/09/2021
Company: Tata Motors Ltd

- The investor will not be able to calculate P/E ratio of TATA Motors because both the standalone & consolidated earnings are negative.
- Therefore, the P/E could only be calculated when the earnings are positive.
- Hence the investor will be benefitted by analysing financials both standalone and consolidated.
Comparative analysis of PAT
Company: Tata Motors Ltd
Below is the quarterly performance of Tata Motors for the quarter ended 31/09/2021
Consolidated Basis:

Standalone Basis:

- The consolidated performance reports a negative PAT.
- The company said it took a one-time exceptional non-cash charge for asset impairment of £3.1 billion and the overall performance was dented on account of JLR.
- The overhang of Brexit with no clarity is affecting the business of its subsidiaries.
- By analyzing the company’s performance on a standalone basis, the company reported a positive PAT.
- Thus, by analyzing the company on a standalone basis it seems profitable business, but when clubbed with the subsidiary’s performance it shows signs of problems.
- The China issues, uncertainty of Brexit is hampering the growth of the company on a consolidated basis.
- However, the company is stating that the domestic business continues with strong momentum and is delivering market share and profitable growth.
Conclusion
- By understanding the difference between standalone and consolidated financial statements in detail, we could conclude that analysing the financials from a consolidated standpoint is better than analysing the financials with a standalone point of view.
- The consolidated financial being analyzed along with a standalone basis will give the investor an in-depth analysis and also the chances of any material information being missed or misinterpreted could be reduced.
- Any investment decision should be taken only after analyzing both the standalone and consolidated financials for companies having subsidiaries.


