Algo Trading
Introduction
The rage of Algorithmic Trading or Algo Trading as we better know it, has been thriving with no end since its introduction in India in 2008. The orthodox houses of wealth who frankly cared so little about terms like sophistication & strategies suddenly felt intimidated by geeks of the tech world. The equity markets have undergone a radical overhaul since then.
Before delving into our lesson, let us get a clear framework to operate & understand a few nuances.
Informally speaking, traders fit into either of the two ranks:
1) Discretionary Traders
They call the shots in terms of when to enter or exit the trade, how to manage the position, fix an appropriate stop loss, and others. Human judgement and emotions play a significant role as trades punched their trades solely based on gut feel. The biggest advantage herein is the flexibility to adapt beyond the imaginable.
2) Systematic Traders
These traders rely on computer systems and software to automatically punch their trades. An algorithmic trading program is also backed by technical analysis, and the degree of human intervention is abysmally low. High-Frequency Trading (HFT), Algorithmic Trading, Pair Trading, Momentum trading, and Passive Index Tracking are all subsets of Systematic trading. Although systematic trading is prominently a foothold of Investment Banks and Hedge Funds, retail participation in this segment is steadily on the rise.
Some differences between Discretionary trading & Systematic trading:
- In discretionary trading, human judgment & emotions play an important role, whereas systematic trading is fully automated, with no manual intervention.
- Discretionary trading has no defined rules, but systematic trading relies on pre-defined rules that are encoded in trading software.
- In discretionary trading, risk management is crucial to avoid huge losses, but risk management is incorporated into algorithms for systematic trading.
- Discretionary trading requires constant monitoring of the markets, but systematic trading does not require tracking as software is already monitoring the markets.
- In discretionary trading, the markets must be monitored continuously, but in systematic trading, the markets are monitored by software.
- Since discretionary trading rules vary in how the trade is executed, there is no valid assessment of success; however, for systematic trading, strategies are backtested against historical data & then implemented.
- Discretionary trading may result in heavy losses if there is any slippage, but systematic trading has low slippage as stop losses are predetermined.
- Discretionary trading is preferred by retail punters. Imagine these traders as a small-cap stock with the potential to give a multibagger return. Institutional players like investment banks, hedge funds, etc., prefer systematic trading. Imagine them like large-cap stocks with good compound growth.
Elaborating a little further on the slippages part, Consider a Discretionary Trader who implements a Long Call Butterfly strategy on the Nifty 50 Index. The trader observes that the index is moving against his position & decides to exit with a small profit. By the time he squares off the ITM call options, the OTM call options may significantly appreciate. This minuscule time lag has the potential to wipe off the entire profits generated by theta decay over multiple trading sessions.
On the other hand, a Systematic Trader would have made use of pre-determined price targets & stop-losses in the course of routine trading. Automated trading softwares would exit all four legs of the strategy at one go.
(Refer to this module for a better understanding of The Butterfly strategy)
This differentiation is not to say that one is better than the other or so but to draw clear lines between the two. In fact, a superior trading system would be one that combines the best of both worlds & makes it work to their advantage.
The Algo Connect
In today's fast-moving world, technology is an indispensable accessory of everyday life, even for a trader.
A single entity can only concentrate on a limited number of stocks or parameters. It is practically not possible for a human to scan amongst a myriad of listed stocks for a potential trade. To give you an idea- there are over 5000 listed companies on the NSE & BSE. Over & above that, some members of the fraternity dip their beaks into commodity, currency & global markets at the same time!
Leave alone cryptocurrencies that trade round the clock.
Investors are faced with an even bigger dilemma in this aspect. It is impractical to go through annual reports, conference calls, press releases, etc of each and every listed stock.
Instead, investors & traders make use of certain indicators to identify their targets. For instance, a trader may long/short only those stocks that are above/below their 50 Day Moving Average (DMA). Similarly, an investor might shortlist only those companies that have reported year-on-year growth in revenues & profits.
A trader may code this algorithm on a computer software, say Python or R and link it to his trading account. This will automate the entire process & the system will forward all buy/sell orders to the exchange without any intervention or monitoring.
In essence, this is Algo Trading in its simplest form.
Technically speaking, Algo Trading is the automated buying & selling of securities using labyrinthine mathematical models & a defined set of instructions known as algorithms to carry out financial transactions at a breakneck speed. The instructions may contain specific variables such as price, time, volume, free float, etc.
The automation of trading processes allows investors to perform their strategies rapidly & more importantly free from human error, thus increasing the probability of profits. Moreover, Algorithm Trading systems do not get tired like manual traders. They work 24/7 to help one achieve the speed & accuracy that is impossible with human trading.
The domination of Algorithmic Trading is such that in developed markets such as the United States & United Kingdom, around 70-80% of the total trading volume is generated through Algorithmic Trading. In emerging market economies like India, the number stands at less than 50% but nonetheless is growing at a brisk pace. As per some recent studies, a whopping 92% of trades in the forex market are performed by trading algorithms.
Advantages of Algo Trading
Now that we have a basic understanding of what Algo Trading is, let us discuss some advantages and disadvantages.
Firstly, let us start with the advantages.
The popularity that Algo-Trading has achieved in a little while is a testament to its profitability. There are also several benefits associated with it such as:
- Speed - High-Frequency Trading or HFT is an extension of Algo-Trading. It is used to place a large number of buy/sell orders across exchanges in a jiffy primarily to make profits from asset mispricings or bid/ask spreads. A study conducted on HFT in India highlighted that the average profit per trade stood at around 2 basis points or 0.02%. Traders employing HFT conduct trades at a lightning speed of 64 millionths of a second! Yes, you read that right!
- Accuracy- Algo Trading can considerably reduce slippages by executing orders on pre-determined specifications. Automated Trading also eliminates the risk of fat-finger errors. Order execution will be precise in absence of human intervention.
- Cost-efficient- Algo Trading enables the execution of a large number of orders in a short span. With increased volumes, transaction costs are reduced as many trades may be processed at once. For instance, option trades are generally charged at ₹20 per order regardless of the order size. A person buying/selling 100 options contracts pays the same brokerage charges as someone who buys/sells a single lot. It is simple economies of scale on function.
- Human emotions have no role to play- What better than this for those traders who find it difficult to stick to their rulebook & frequently indulge in sins such as overtrading, over-leveraging, no stop losses, poor risk management, improper position sizing, etc.
- Backtesting- The probability of success for an algorithm can be verified by backtesting it on historical data. Based on the results, strategies can be fine-tuned to perfection & made viable to use.
- Automation of the asset allocation process- Usually institutions such as Mutual Funds houses, Insurance companies, Hedge Fund managers, etc stick to a particular asset allocation say 60:40 debt to equity. Similarly, an individual investor may not want to allocate more than 20% of his capital to a single sector. An automated trading algorithm helps to maintain the optimum asset allocation by frequently rebalancing the portfolio.
- No need for constant monitoring- A trader does not need to be glued to the screen all the time if he has an algorithm in place. He can devote time to other activities and simply let money work for him.
- Enhanced liquidity- Algo Trading has greatly helped in improving the market depth as well as the overall liquidity in the market. This has led to increased participation since investors generally prefer liquid markets as they are less prone to manipulation.
- Diversification- An investor can scan opportunities across markets, assets & instruments simultaneously. This diversification would have been challenging to implement otherwise if not for automation & algorithms.
Disadvantages of Algo Trading
Now let us discuss the disadvantages.
Algorithmic Trading is not for the faint-hearted. Before venturing into this field, it is key to know what holds back majority of the masses:
- Knowledge of the programming language- Formulating complex algorithms requires extensive know-how of coding software such as C+, C++, Java, Python, R, etc. Finance professionals may not be familiar with technical knowledge. It is also not a feasible idea to get the code done by a third party as it may require frequent modification to suit the current market conditions. A strong programming foundation is essential.
- Dependence on technology - Faulty algorithms have the potential to result in insurmountable losses for the trader. Critics blame algorithms for the flash crash of 2010 that led to the Dow Jones Industrial Average cracking 9% & wiping about $1 trillion in stock values in a matter of a few minutes. A similar incident happened in 2018 in the Indian Markets when the Nifty Index crashed around 900 points in a few seconds, only to recover fully at the end of the day. Such freak trades trigger stop losses of other open positions, which further exaggerates the selling pressure.
- Regulatory hurdles- Algo Trading is subject to several regulatory restrictions in different countries. The Securities and Exchange Board of India (SEBI) has come up with a slew of measures in recent times to smoothen market volatilities & reduce systematic risks linked to algo trading. This point will be discussed separately later in the module.
- Short lifespan- Not all algorithms function effectively in different market conditions. The inherent volatile nature of equity markets makes it necessary to quickly accommodate to the changing landscape. As an illustration, let us assess a simple strategy of going long-only on those stocks that close above their 50 DMA. The success of such an approach is critical to the market texture. If the markets reverse their course and go into a bearish mode, the trades will likely hit stop-losses more frequently. The formulation of algorithms & strategies is a continuous process & it consists of regular monitoring, improving & re-inventing according to the market dynamics.
- Requirement of resources- A trader needs to arrange for substantial high-end resources as well as low-latency infrastructure. There are magnanimous co-location costs (upwards of ₹13 lakh an annum for a full rack as per data on the NSE website) associated with it. Such expenditure coupled with a lack of expertise in maintenance & troubleshooting makes co-location unviable for small/medium-sized broking firms. We shall cover this point in greater detail in the next slide.
- The risk of over-optimization- Strategies on paper even though thoroughly backtested may fail to perform during live trading. The back-tested data may represent a specific market period or condition that is completely oblivious to the present-day scenario. There is always a running risk that the program might be over-trained to fit certain trends aka the risk of over-optimization.
- Front-Running- Quant Funds make use of futuristic algorithms that have the potential to detect impending large orders by institutional investors enabling traders to profit from front-running these securities. Put another way, upon sensing an incoming order flow, the system generates buy orders & then turns around & sells them to the institution at a slightly higher price.
Importance of Co-location
While discussing the disadvantages of Algo trading, we have come across the term Co-location cost. But what exactly is Co-location, and what is its importance in Algo trading?
The National Stock Exchange (NSE) started offering co-location facilities to some of its members in 2009 in exchange for a fee. A co-location facility or colo is principally a data center in which a business can rent space for servers & other computing hardware.
Materially, co-location services meant that the NSE would allow some brokers to keep their servers in the same building that houses the exchange.
It is a well-acknowledged gospel in the trading community that the first one to react to a news headline can use it to their advantage. Traders constantly thrive to cut down on their reaction time i.e., the time between the receipt of the new information and taking trades based on it.
In the race to be the fastest to respond, many broking firms have opted for the co-location facility. Its advantages include reduced latency i.e., the time taken by your trading system to respond to any trigger. The broad theme behind this idea is that your data (read instruction) travels much faster in case the server is located in the same building as the exchange. Hence, the order can be executed swiftly.
The difference of a few split-seconds would not cause any inconvenience as such to a normal trader but it can surely turn the tables for those into High-Frequency Trading (HFT) or market-making that require a sizable degree of technology & infrastructure expenditure.
From the perspective of a retail trader, the co-location facility has aided to form a more efficient marketplace by enabling quick price discovery. Additionally, the bid-ask spreads have been reduced on account of improved liquidity.
Present-day, almost every major broking firm in India such as Zerodha, Upstox, ICICI Securities, Sharekhan, Motilal Oswal, Angel Broking and so forth have availed this provision to facilitate faster execution of their client's trades.
As a matter of fact, The Bombay Stock Exchange is the fastest in the world with an order execution speed of 6 microseconds. It also boasts of being the fastest co-location service in India with a round-trip network latency of less than 10 microseconds.
How to get started?
Now that we understand algo trading and its advantages & disadvantages. Let us know how to get started with it.
1) Getting the basics right
It is not advisable to get into algorithmic trading without a minimum experience of two-three years in the capital markets. Newbies must practice discretionary trading/paper trading during this period to sharpen their skills. Practical experience will give you a proper idea about the behaviour of different market instruments and their correspondent price behaviour. Such knowledge cannot be imparted through books & can only be gained over a while. Remember, Algorithmic Trading is a specialization. One must lay a strong foundation before aiming for the sky.
2) Data collection
A prerequisite of an effective strategy is data collection. This data can be anything ranging from Technical indicators like RSI, MACD range, Bollinger Bands, Fibonacci levels, Pivot levels, Volume, Stock price, or Fundamental metrics such as ROE, ROCE, P/E Ratio, OPM, etc. Data vendors may come in handy at this juncture.
There is a popular saying in the computing world- Garbage In Garbage Out (GIGO). At heart, the acronym tends to point that the quality of output is determined by the quality of input. Flawed or incorrect data values will give nonsense outputs or “garbage”.
Hence, utmost care must be taken while collecting the data & cleaning it. Data cleaning refers to the procedure of fixing/correcting incorrect or corrupted data values. The data set must also be checked for any outliers or distorted values.
The algorithm shall be tested on this data set to validate its efficacy.
3) Strategy Development
The next natural step is to formulate a strategy that works for you. Background knowledge of programming languages such as Java, Julia, Python, R, Matlab, C+, C++, etc will prove to be extremely beneficial. The choice of language shall rely upon the coder's comfort, frequency of trades, data structure, acceptable latency, network bandwidth, etc
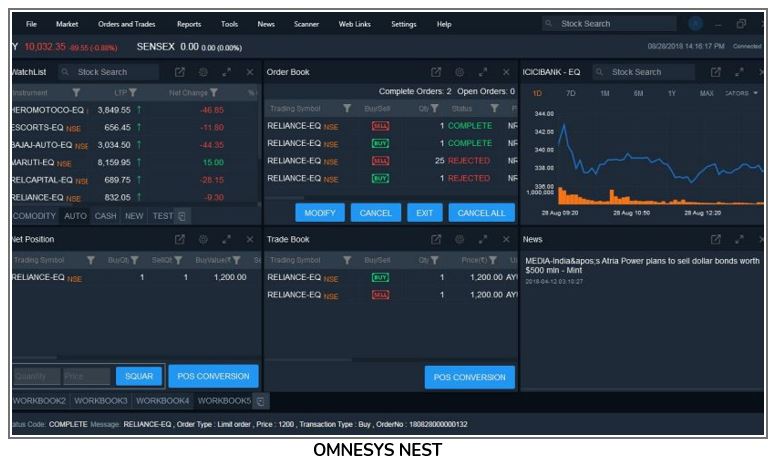
Modern-day brokers have tied up with various algorithmic trading platforms such as Streak or Algoji that allow participants without any proficiency in coding to create, customize & automate their strategies. The tech-savvy may make use of platforms like AmiBroker, Omnesys NEST, Presto ATS, ODIN, FlexTrade, Algonomics, MetaTrader, and the like.

It must also be comprehended how passive/aggressive the strategy will be otherwise “quoting” or “hitting”.
a)Hitting- Placing buy orders at the ask price & sell orders at the bid price
b)Quoting- Placing buy orders at the bid price & sell orders at the ask price.
Instead of emphasizing on creating complex algorithms with too many rules, traders should focus on the clarity of strategies that can outperform the market in the long run.
4) Backtesting
The developed strategies cannot be straightaway traded in live markets. Every algorithm must go through a tedious backtesting process to prove its mettle. In this step, the algorithm is run on historical datasets to check its final outcome.
Platforms such as Kuants, TradingView Streak, Techniqo, Square Off, etc can be convenient in this regard

5) Parameter Optimization
This step shall lead you to either of the two consequences-either you will end up completely discarding the hypothesis or deriving actionable insights.
It may happen that the system does not throw up desired risk-adjusted returns based on the sample datasets. In this case, the trader must optimize the algorithm by tweaking certain rules and again backtesting it to check if the risk-reward ratio turns favorable. The idea needs to be completely scrapped if the sought results are not obtained even after multiple attempts.
In case the algorithm achieves the said purpose, the strategy must further be tested on out-of-sample data sets to avoid the risk of overfitting or over-optimization.
The trader must keep in mind that the returns generated through this methodology exceed that of buy & hold returns & that maximum drawdowns do not exceed his risk appetite.
6) Going Live & Active Risk Management
If the algorithm prevails on an out-of-sample dataset, only then it must be tested for execution. The strategy must then be connected to the API of your broker for seamless operation.
At this stage, some errors such as brokerage assumptions, liquidity, coding errors, etc can be identified. Initially, the order sizes must be small & the larger focus must be on the success of the algorithm.
The trader must actively manage his risk -putting to work Value At Risk (VaR) and Expected Shortfall (ES) measures. Total Returns (CAGR), Sharpe Ratio, Hit Ratio, Maximum Drawdown, Volatility of returns, Average profit per trade, Average loss per trade are other metrics to ascertain the performance of the strategy.
A brief explainer for these terms:
a)VaR - or Value at Risk refers to the maximum amount of loss that can be incurred in a certain time period at a given confidence level under normal circumstances
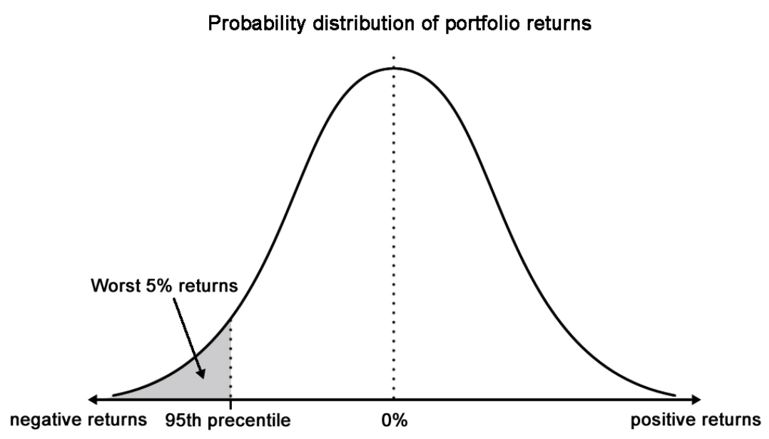
The above image shows the VaR of a portfolio at 95% confidence interval
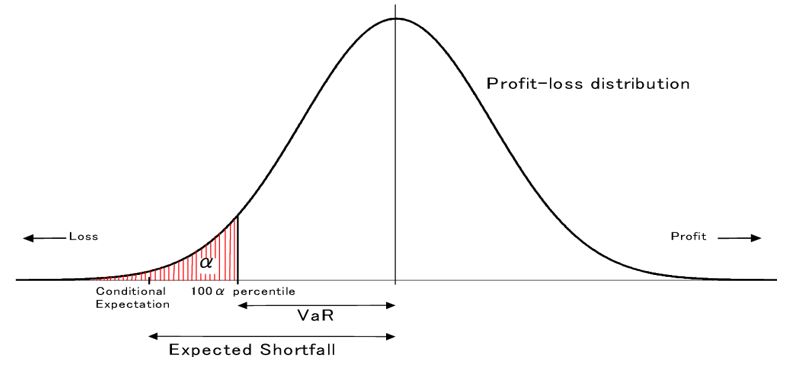
b)Expected Shortfall (ES)- refers to the expected loss amount at a certain confidence interval once the loss amount exceeds the VaR. In other words, if VaR tells us “How bad things can get?”, ES tells us “ What is our expected loss if things do get bad? “
c)Total Returns - Compounded Annual Growth Rate (CAGR) returns must be calculated & used instead of absolute returns.
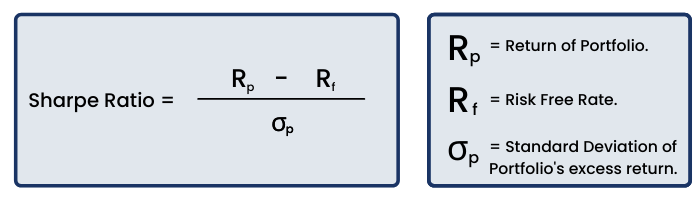
d)Sharpe Ratio- measures the risk-adjusted performance of the strategy. It verifies that the alpha obtained through the algorithm is on account of managerial skill instead of excessive risk taking.
e)Hit Ratio- is the ratio of the number of profitable trades divided by the total number of trades. Ideally, you should be striving for a hit rate of anywhere between 50-70% and a risk-reward ratio greater than 1:2.
f)Maximum Drawdown- or MDD measures the maximum fall in the portfolio value from its peak to the trough (before a new high is achieved i.e. high watermark).
The trader must immediately exit all open positions & stop the algorithm in case things go awry. Apart from this, the trader must keep an eye on evolving trends/ sectoral shifts in case of which the code might have to be altered or junked altogether. Recall that every strategy has a limited lifetime.
Trading strategies
In this part of the module, we will go through some time-tested algorithmic trading strategies employed by successful traders. These setups can be combined with other rules & fine-tuned as per the trader's ease. Let us begin:
1) Momentum/ Trend-following strategies
The premise behind this idea is straightforward- Jump onto the bandwagon as soon as the ball starts rolling. Put it another way, stocks that go up are likely to go up further & stocks going down will likely continue their downward trajectory. Momentum-based algorithms simply follow the direction of the stock as soon as there is a spike in volatility. The algorithm is further supported by the use of technical indicators such as moving averages, channel breakouts, time-series data points, etc. Momentum investing strategies have generally been known to outperform the index by a huge quantum. Open-Range Breakout (ORB) is another momentum strategy employed by day traders with a short-term view.
2) Mean Reversion strategies
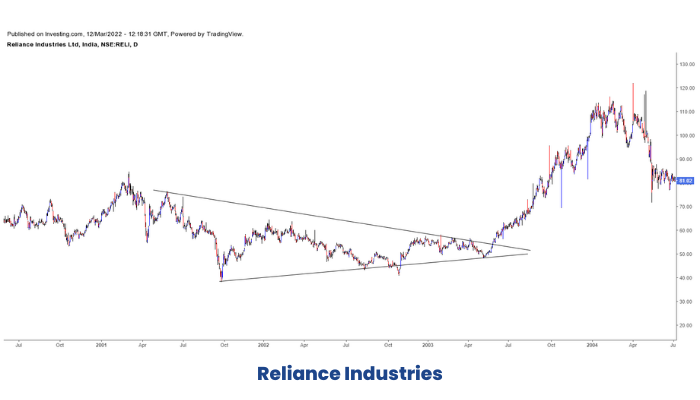
It best suits those stocks that have been range-bound over some time. The algorithm generates sell orders when the stock reaches the upper end of the band & buy orders when the stock is near its support or the lower end of the band. The general concept behind this idea is that asset prices return to their mean value periodically. For instance, the stock price of Reliance Industries moved in a narrow channel of 15% for a period of more than 7 years between 2009-2016. A trader would have made a fortune by applying such a tactic on the stock of Reliance Industries. It is a sign of an astute trader to change a mean reversion strategy into a momentum play once the stock breaks out of its range.
Pair/Spread trading is another widely used mean-reversion strategy. It might be used on two highly-correlated securities viz the likes of Bajaj Finance & Bajaj Finserv.
Look at the below chart of Bajaj Finance (blue line) and Bajaj Finserv (orange line):

The above chart goes on to show that price movements of both the stocks are highly in sync with each other.
Stocks operating in the same sector such as Bajaj Auto and TVS Motors or ACC & Ambuja Cement are also good proxies to play this trade. Additionally, one can also inhibit index values in the trade. For instance, if a trader expects the stock of State Bank of India to outperform the market, he may go long on it and simultaneously short the Bank Nifty.
The next logical thing to do after shortlisting a trading pair is to work out the historical spread or price ratio between the two.
Historical closing prices can be obtained from the NSE website.
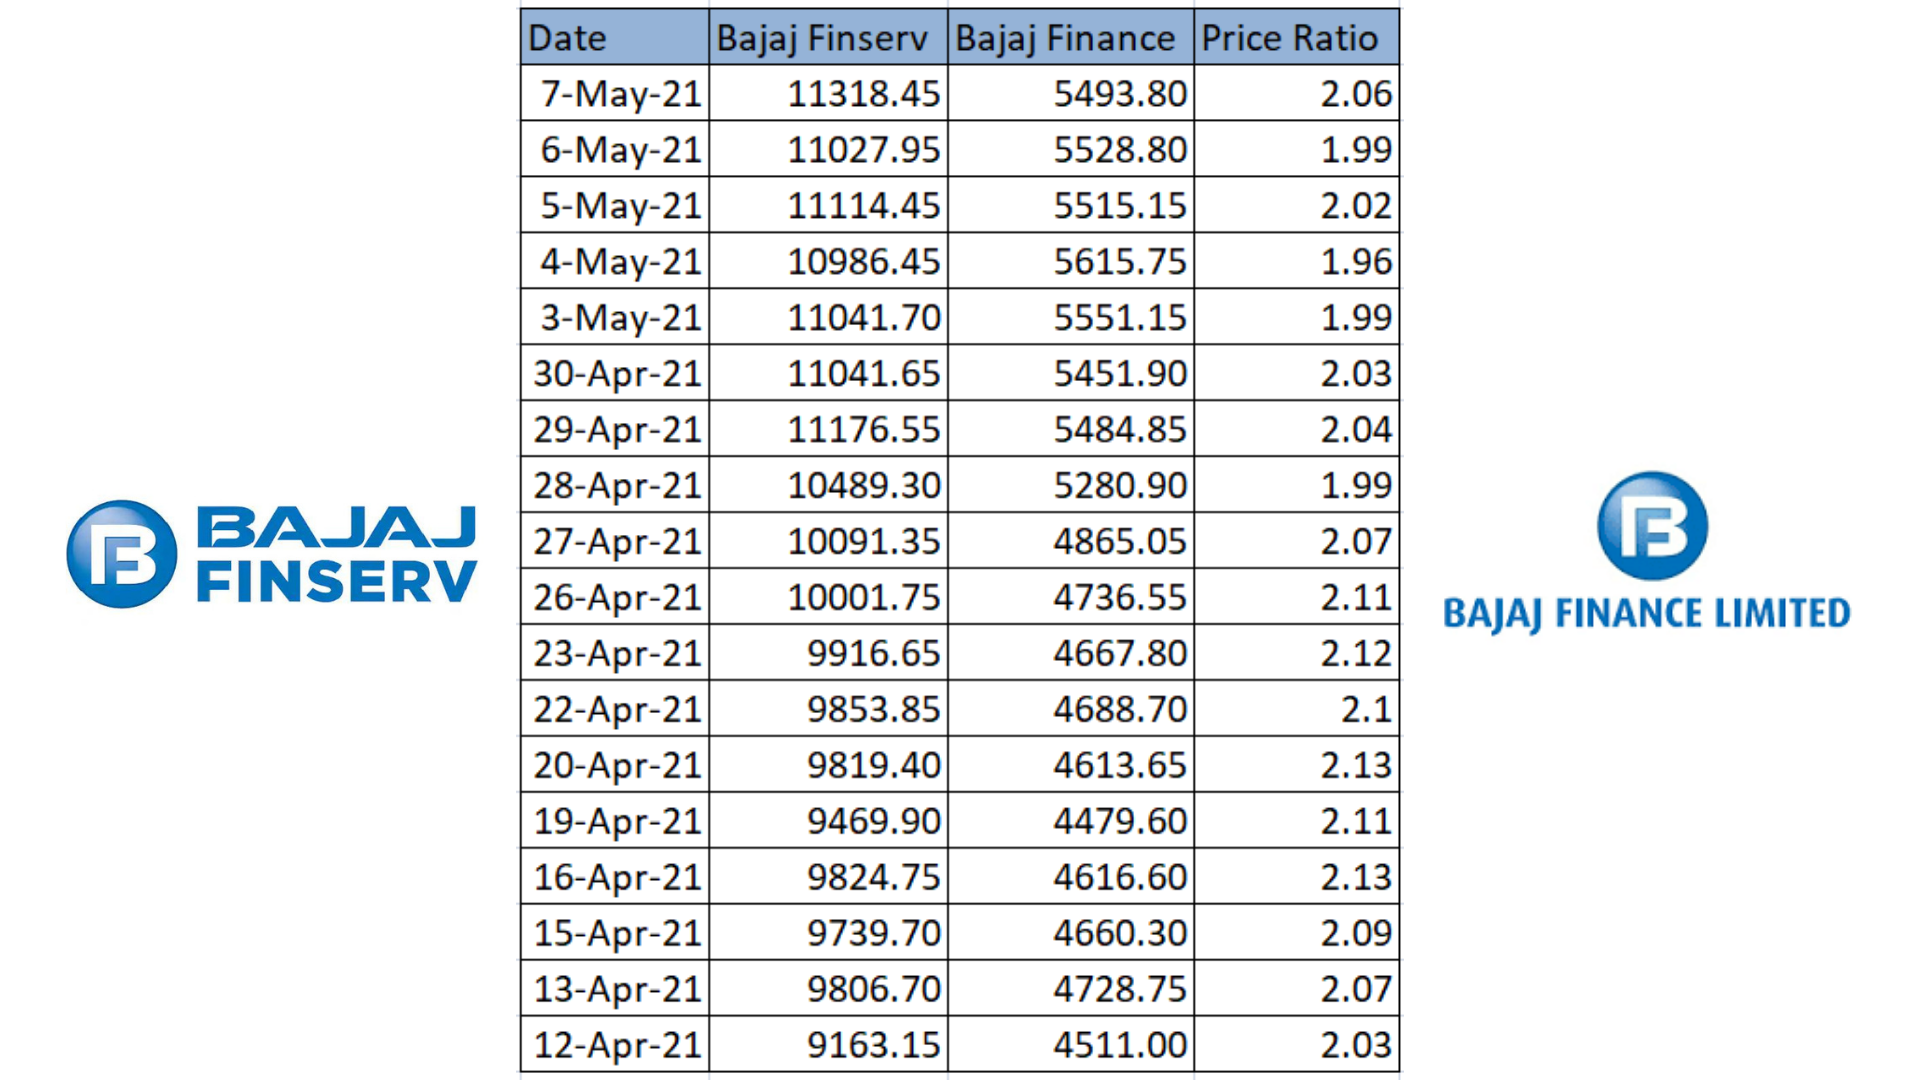
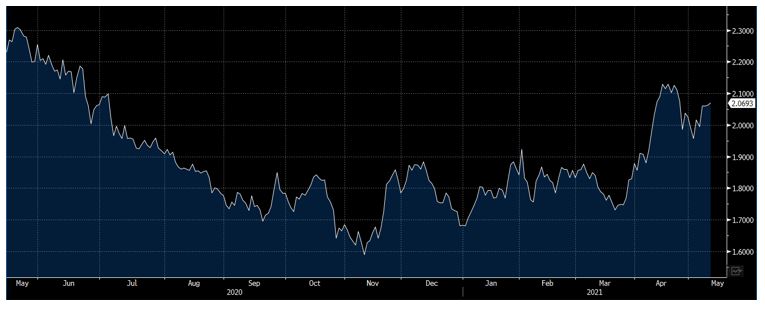
This is just a sample dataset but the same must be done for at least a year to check the upper and lower band of the ratio. As observed from the data, the price ratio oscillated in a range of 1.6-2.13 during this time period, both depicted in the table as well as the chart.
The opportunity for a trade arises when the ratio reaches close to the upper or the lower end of the band i.e., sell at the top and buy at the bottom.
This was an overly simplistic depiction of the analogy behind pair trading. Other complex statistical arbitrage tools such as mean, standard deviation, maximum & minimum deviation from the mean, Adf test stats, Adf critical values, p-values, and so on are used in conjunction on this dataset.
3) Sentiment strategies
Sentiment-based analysis is another emerging & powerful tool that traders can utilize to stay ahead of the curve. Such algorithms are based on the perception of other market participants and where they expect asset prices to head. Every asset is alloted a sentiment score based on which the quantity to be traded is decided. The data for such algorithms might constitute Google search trends, Reddit posts, Twitter mentions, brokerage reports, FII data, Put Call Ratios and others. Studies have also shown that there is a high correlation between investors' information gathering on social media & market participants' trading decisions.
Another example of sentiment strategies can be those algorithms that generate bullish/bearish signals in anticipation of Mutual funds/HNI buying/selling. Aptly quoted, Artificial Intelligence is the future.
The Gamestop (NYSE:GME) Saga in the United States is a timeless example of how sentiment strategies can be used to spot once-in-a lifetime trades.
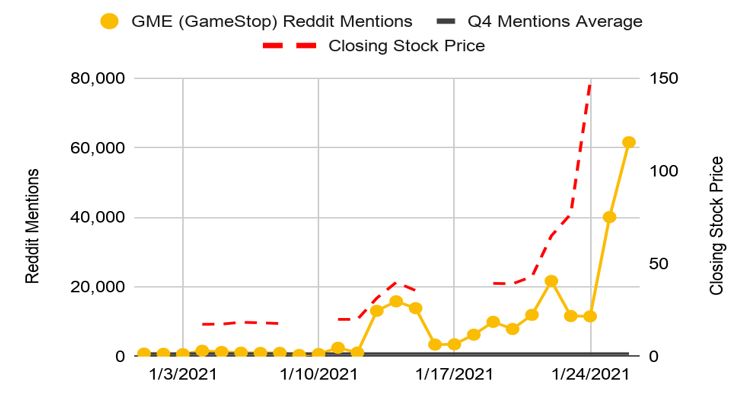
Social media buzz around the GME stock had started picking up days before the stock exploded by 2500% in a single month.
4) Market-making
Market-making or jobbing is a type of HFT that involves buying & selling securities continuously within a short span of time. By doing so, they provide liquidity to the markets & are hence rewarded for their inventory risk by bagging the bid-ask spreads. Back in the day, jobbing was mostly done by humans but these days it's almost entirely automated. Some market makers also take overnight positions i.e., carry long & short positions on a diverse basket of stocks indefinitely. Agility, high-quality data & low-latency infrastructure are the troikas of an eminent market-maker.
Scalping aka scalp trading is another fast-paced strategy that can be used to capture small price movements. Scalpers depend largely on technical analysis & use a number of indicators such as RSI, Stochastics, Bollinger Bands, etc to hunt potential trades. Herein, positions are held for a matter of seconds or minutes instead of hours/days. High winning ratio is critical for a scalper as they exit as soon as the position reaches a target profit percentage.
5) Arbitrage strategies
They involve buying & selling of the same security on different exchanges with a view to make a riskless profit on account of pricing inefficiencies. The stock is bought on the exchange that gives a lower price quote & sold on the one with the higher price. The existence of arbitrageurs eliminates the mispricing thereby establishing equilibrium again. Such opportunities are difficult to spot with the naked eye and can only be identified by leveraging algorithms. With that being said, the average annual returns earned via these strategies is not lucrative enough & is more or less equivalent to those earned by liquid funds.
6) Weighted average price strategies
Strategies such as Time Weighted Average Price (TWAP) or Volume Weighted Average Price (VWAP) can be used for filling up large orders at favorable prices. Case in point, ABC Mutual Funds wants to offload 10,00 shares of XYZ Corporation. He can simply employ a TWAP algorithm so that the order gets traded in small slices at regular intervals throughout the day. Similarly, the trader might use a VWAP algorithm to execute the trade close to the desired price.
7) Machine Learning-Based
Artificial Intelligence is the new buzzword in quantitative finance. Instead of hard-bound rules, Machine Learning algorithms allow a system to observe what’s happening in the environment and incorporate new data from the market into the decision-making process. There are umpteen trading strategies that can be deployed in this segment.
Technical Checklist
Here is a quick checklist of all the things you need to take care of before starting your algo trading journey.
Algorithm Trading Checklist:
1) Strategy Checklist:
- A programmable strategy
- Stock screening & Entry/Exit rules
- Position Sizing rules
2) Software Checklist:
- Programming language or a tool to code the strategy rules
- Integrate the executable program the broker's terminal
- Backtest the strategy on historical data & optimize parameters
3) Hardware Checklist:
- Computer with at least 16GB RAM & Quad-Core CPU.
- High bandwidth internet connection
- Power & internet backup
4) Data Checklist:
- A reliable source of historical & real-time data for the stocks/commodities.
- Data backfill of at least 5 years for backtesting
- Live streaming of data into the algorithmic system
5) Execution Checklist:
- VPS server to deploy the algorithmic system
- Get exchange approvals if required
- Monitor generated trades and Optimize regularly
6) Miscellaneous Checklist:
- Scalable hardware & software with regular backups
- Update anti-virus & firewalls to prevent any security breach
- Optimize performance to reduce order latencies.
Regulatory Measures
So long as institutional investors & regulatory bodies have acknowledged the merits of algorithmic trading, its potential cascading effects have been a long-standing point of debate.
The Securities and Exchange Board of India (SEBI) has kept the interests of retail investors in mind & ensured a frictionless & systematic transition to algorithmic trading since its introduction in 2008. Over the years, SEBI has proactively come up with a host of guidelines to strengthen the algorithmic trading framework in India:
Approvals
All traders & investors, right from individuals to hedge funds are authorized to perform algo trading.
If the algorithmic program involves human intervention, exchange approvals are not mandatory. However, if trading is automated or is carried out using robots, where manual intervention is not required, prior approvals from the respective exchanges are requisite. It is also imperative to note that the exchange can flag automated order execution through cutting-edge software.
Note- Clients can seek assistance from their brokers to get their algorithms speedily validated by the exchange.
Order to Trade Ratio
OTR can be computed as the ratio of the total number of order submissions, modifications & cancellations for an order over the number of trades a client does on the exchange.
Recall that Algo traders usually place a large number of orders to capitalize on opportunities that exist in a very short time frame. The OTR framework was introduced to disincentivize traders from placing large (fake) trades without the intention of executing them with a motive to manipulate the order book.
Currently, an OTR greater than 50 attracts a penalty from the exchange. For an OTR of more than 500, in addition to the penalty, the client would not be allowed to trade for the first 15 minutes of the next trading day.
Penalty shall also be imposed on algo orders placed beyond 0.75% of the Last Traded Price (LTP) in either direction.
Tick-by-Tick Data Feed
A tick-by-tick (TBT) data feed provides details pertaining to orders (addition + modification + cancellation) & trades on a real-time basis. A TBT data feed facilitates a comprehensive view of the order book.
Earlier, this facility was only made available to desirable market participants upon paying requisite fees. However, in 2018, the SEBI directed stock exchanges to provide TBT data to all the trading members free of charge.
The objective behind such a move was to adhere to the principle of market fairness by providing a level playing field to all the market participants irrespective of their technological/financial resources
Shared co-location services
We have already highlighted the magnanimous costs associated with availing a co-location facility.
The SEBI introduced shared co-location services in 2018 thereby drastically reducing costs for smaller trading members wishing to operate from the co-location facility
Mock Trading
Exchanges conduct mock trading sessions on any one Saturday in a given month. During this session, the brokers put to test their trading infrastructure, recovery & response mechanisms, new products/services, contingency drills, etc.
The SEBI encourages brokers & members with approved algorithms to participate in these mock trading sessions so that traders can verify their trading applications for various functionalities inclusive of exceptional market conditions.
In addition, the SEBI instructed stock exchanges to make available a simulated market environment for testing of trading software over & above the existing mock trading sessions.
Conclusion
In the world of finance, hardly anything can be predicted with absolute certainty. However, we profoundly believe that India’s transformation from its current status of an emerging market into a developed market is underway & is only going to accelerate in the coming years. This will be a natural, long-drawn process spanning over the next few decades.
In the ensuing years, the share of algorithmic trading in total trading volumes is expected to rise more notably and reach the levels currently honed by first-world countries.
Human traders must really have an edge to compete with AI-enabled devices that have the muscle to scan opportunities across assets, borders & exchanges. The mantra is simple- adapt or perish.


