Introduction to Sector Rotation
As we know, a business cycle manifests itself in four stages: Expansion, Peak, Contraction & Trough (more on this later). Stock Markets are a leading indicator of economic health and hence valuations are correspondent to stages of the business cycle.
Sector rotation is important to stock market investors because certain sectors perform well in a particular stage of the business cycle, while others do not. If we can assess the possible performance of each sector during each phase of the market cycle, it will be easy to select the stocks. Once that phase of the economic cycle is over, we can shift the invested money to another sector that is suitable for the next market cycle.
A sector is a group of similar industries or companies that have a common trait. Dividing an economy into different sectors can help us to analyze and compare them in a better and sensible manner. It is imperative to note that each sector has unique characteristics as well as risk profiles.
Stocks can be classified into sectors based on the products/services they offer. For example, the Chemical Sector will have the companies which produce chemicals. Similarly, the Automobile Sector will have the companies which produce automobiles or its parts.
Additionally, the demand supply dynamics are also crucial to understand. For instance, a good monsoon is considered as a positive sign for agriculture related stocks such as pumps, tractors, fertilizers, etc. Similarly, monsoons are a lean period for cement & construction companies . Hence, understanding the key drivers of the stock is a prerequisite for mastering the art of sector rotation.
Every sector has suitable valuation metrics attributed to it as per its growth prospects, competition, entry-exit barriers and different economic realities. There is no one size fits all approach when it comes to deciding appropriate valuation metrics. For instance, The Price to Earnings Ratio (P/E) may be suitable to value a consumer goods company but it would be unwise to use the same to determine valuations of Banking & NBFC stocks.
It has often been seen that weak stocks in a sector benefit from a favorable regulatory/economic environment. The overall positive buzz surrounding the sector propels the stock to perform well. On the other hand, if a sector is underperforming for quite some time, a good stock belonging to the sector with an excellent track record as well as management prudence, may still fail to generate wealth for investors.
Analysts use two types of approaches for analyzing a stock, namely the Top-Down Approach and Bottom-Up Approach.
Economic Cycle and Its Participants
Previously, we have learned that sector rotations are linked to economic cycles. Now in this section, let us elaborate on this concept and also discuss the participants in the economic cycle. But before we go further in this module, let us get a grasp of some basic concepts on economy & liquidity for better understanding. Sector rotation and analysis is a top-down approach. The philosophy behind sector rotation strategy is that we can earn profits by keeping a tab on the economic cycles. We can also choose to buy or sell stocks based on their performance in each cycle. Let us try to understand the economic cycle in detail because it is a pivotal factor behind sector rotation and its identification. The key participants of an economic cycle are listed below.
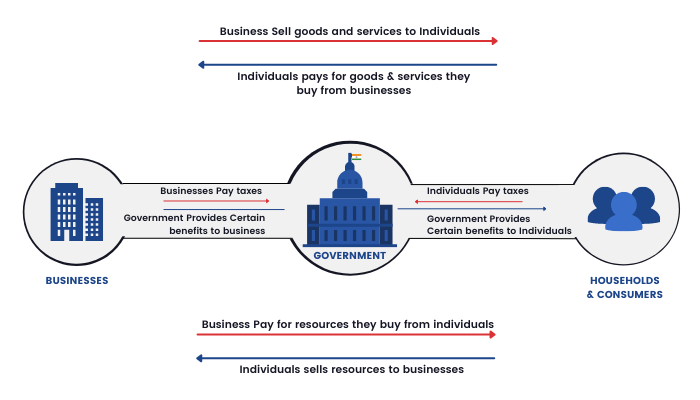
Household/Consumer:
There are many parties involved in an economic cycle but the most important party which is involved in this cycle is the Household/Consumer Sector. This sector comprises common people like us who principally are the drivers of consumption. We generate the majority of the consumption demand in our economy. Household sector is also the primary supplier of labor and capital in our economy.
Businesses:
Businesses produce the goods and services which meet the needs of its consumers and households i.e., businesses utilize the resources which are available in an economy and make them into productive goods and services which the consumers will ultimately consume. They allocate capital efficiently to its most productive uses and create wealth for their stakeholders.
Government:
The government plays a pivotal role in our economy by allocating resources to the underdeveloped regions & weaker sections of the society. Some of its functions include:
A.Reducing Income Inequality- between the rich & poor is one of the principal objectives of the government.
B.Stabilizing an Economy: We shouldn’t forget what happened to countries like Argentina where hyperinflation led to a major fall in the value of money or Japan where the growth has flattened since the late 1980’s.
C.Collection of Taxes: This is perhaps the most important part where the Government collects taxes and re-distributes to the weaker sections of the society in the form of tax sops, subsidies, etc.
In an ideal situation, all three participants actively participate in generating revenue and growth in the economy.
Liquidity Cycle
Previously, we briefly learned about the concept of liquidity in an economy. In this section, let us understand the 'Liquidity cycle' and its parameters.
What is the Liquidity Cycle and how does it work?
Liquidity cycle plays a very important role in identifying sectors to invest in. Remember, It’s the money flow which makes a particular sector move. Given the economic cycle and the participants in the economic cycle, how does the liquidity cycle work amongst the various economic groups? There are few parameters by which we can understand the liquidity cycle:

1.Money Supply:
The Reserve Bank of India has the sole & exclusive right to print currency notes in the country. Money Supply is one of the major tools any central bank uses to control inflation. If the inflation is negative, RBI increases the money supply and vice-versa. The money supply and the amount of money the central bank prints depends on if the inflation is Demand-pull Inflation or a Cost-Push Inflation.
2.Businesses & Households:
The increased money supply finds its way into the economy as banks loan out the same to businesses & individuals. It is assumed that this money is either invested into productive resources or used for consumption purposes. Businesses also pay salary to their employees- a part of which is saved.
3.Consumption:
The increased money flow is also used for consumption purposes
4.Investment:
The savings can either be kept in the form of cash or invested in various asset classes such as Equity, Gold, Real Estate, Fixed Deposits, etc.
Investment bubbles take place when a certain story or belief is sold to a common investor. There is an increased demand in a particular asset class like a rat race. Bubbles lead to huge disruption in an economy such as unemployment, recession, etc.
5.Interest Rates:
A key factor that drives liquidity is interest rates as money can only be availed at a cost. Low interest rates drive up the demand for money & vice-versa.

If we look at the table above, it shows the GDP, interest rate and inflation rates of various countries in April 2020. The Euro zone had zero interest rates and Japan had negative interest rates.
If we look over the data of the past two to three decades, every time a bubble is created, the interest rates go down to mute the impact of that bubble.
The story of India too is quite similar in this regard and the same can be judged from the graph below. Markets crash, interest rates go down and once again equity markets perform phenomenally.

The above image shows us the relationship between interest rates and the stock markets of India. If we look around the year 2008, the stock market crashed heavily due to the Subprime Mortgage Crisis in the US. Gradually the interest rates started dipping from 7% to 4% and the mainline indices regained strength.
Similarly, the entire sequence of events was repeated in 2020, albeit the pace of the market cycle was much faster this time. Hence, it becomes amply clear that interest rates are the primary driver behind market momentum.
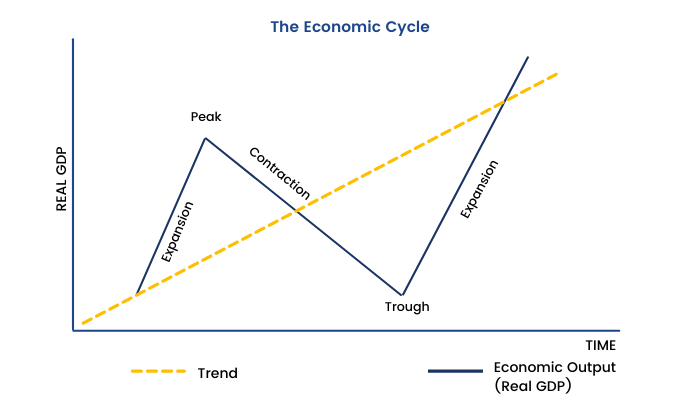
Phases of an Economic Cycle
After understanding the liquidity flow and the economic groups, we now need to understand the different phases of an economy to grasp the sector rotation concept. The economy as well as the stock markets always move in cycles or phases. Understanding this cycle or phase is important as each of these phases have distinctive characteristics and accordingly different sectors of the economy react to them. There are five distinct phases of economic cycle:
1. Expansion Phase: Expansion is a phase where the business activities all around increase and operate in full momentum. This results in the GDP (Gross Domestic Product) to grow and we see a rise in employment, consumer confidence and other macroeconomic factors. Equity markets normally do well in this phase and so it's also referred to as an economic recovery.
2. Peak: Peak is the highest point of the economic cycle when the business activities are soaring to new highs every day. This is the phase between the end of the expansion and the beginning of the contraction cycle. The peak period is characterized by an all-round optimism in the economy—income, employment, output and price level all tend to rise. Investments also rise in the economy.
3. Contraction: Contraction phase of the economic cycle follows the peak and marks the onset of the business activity decline. The overall economy also starts indicating a downward trend. During the contraction phase not only there is a fall in GDP but also the level of employment is reduced. Investment also decreases causing further fall in consumption of goods and services.
4. Recession: The recession in a business cycle is a contraction phase that depicts a general slowdown in the activities is intensifying. The macroeconomic indicators like GDP, investment spending, capital expenditure and per capita income reduces and negative indicators such as joblessness, inflation and bankruptcy are on a rise. During this phase the demand of firms and households for goods and services start to fall. No new industries are set up. Sometimes, existing industries are shut down.
5. Trough: Trough marks the end of a recession and the transition phase into expansion. In short, it is the turning point in the economic cycle after the end of a downward spiral of activity. The stock market, just like the economy, also goes through a cycle which consists of four phases.
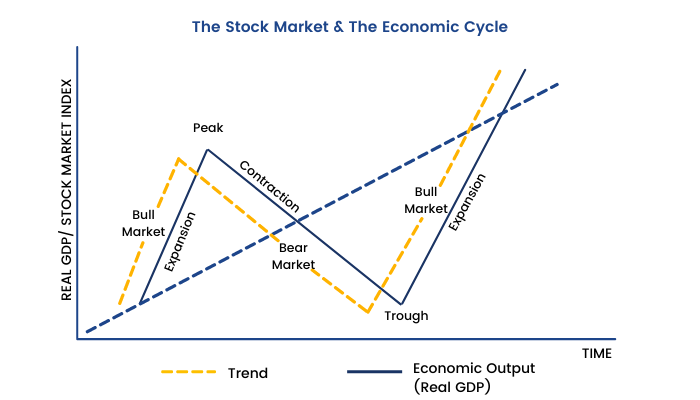
The stock market cycles are closely related to the economic cycle and phases. The stock market cycle occurs ahead of the economic cycle because investors anticipate economic impact beforehand. It lasts somewhere from a week to a few years.
Phases of Stock Market Cycle
Similar to the phases of an economic cycle, there are phases of the stock market cycle. Let us discuss in this section.
The stock market and the economy have a fascinating relationship; the two are not one and the same. Stock markets also move in cycles and have distinctive phases. The stock market and its cycles always move in advance of the economy i.e. it is a leading indicator of economic activity.
Let's take the market crash of 2020 as an example. During that point in time, all the key indicators revealed that the economy worldwide has gone for a toss due to incessant lockdowns and is not in a good shape at all. In spite of that, the global equity market has largely been buoyant and moving on an upward trajectory on account of better-than-expected corporate earnings in the coming quarters and on expectations of supportive tax reforms and aid by the government.
It is a must to be aware about stock market cycles to get a whiff of the market direction and the suitable macro as well as micro asset allocation strategy to be used.
The stock market cycle can be broadly divided into four phases.
Accumulation phase
This phase of the stock market shall occur after the market reaches its bottom. At this stage, Insiders, value investors and few experienced mutual funds begin to buy, judging that the worst is over. Valuations at this phase are very attractive. However, general market sentiment is still bearish.
Mark up phase
During this stage, the market is stable and gradually starts to move higher. Smart technical analysts recognize the market direction and identify that the market is making higher highs and higher lows. Sentiments gradually change towards positivity. Media stories begin to discuss the possibility that the worst is over. As this phase matures more investors jump in. Predominantly, emotions like greed steps in and fear is eliminated amongst the investors and traders.
Distribution phase
This is the third phase of the stock market and here the sellers begin to dominate the market. There are a considerable number of sellers who enter the market and arrest the upward momentum. Typically, prices move in a narrow sideways range during this period. The strong hands who had entered during the accumulation & mark-up phase cash out on their profits.
Mark down phase
The mark down is the final phase of the market cycle. The selling by strong hands spills over to the broader market as the excess supply becomes too much to cope with. With prices following a downward trajectory, the market sentiment gets bearish. Some investors who entered the market when prices were at their peak may hold on to their investments with the hope that the prices will rise again. Emotions such as fear and hope dominate this phase. Unfortunately, prices continue to fall and this provides a buying opportunity for investors who are able to identify the end of the downwards trend. And hence, the cycle starts all over again.
It is important to identify which phase we are in and the psychology behind each phase. Our trading and investment strategies depend on them.
Interrelation between Economic cycle & Stock market cycle
Now that we understand both the economic cycle and stock market cycle let us discuss the interrelation between the two.
How is the Stock Market Cycle and the Economic Cycle inter-related?
The stock market cycle typically runs more or less parallel to the economic cycle – but it is always ahead of the economic cycle as explained above. Most economists and analysts consider the stock market as one of the leading indicators to determine where the economy is heading and to estimate the degree of expansion or contraction in the next phase of the economic cycle.
Stock markets are forward looking and they reflect expected future earnings. It is important to have a clear understanding of the time lag between the economic cycle and the stock markets.
The lag between the stock market cycle and the economic cycle creates a challenge for investors, as strong emotions at both peaks and troughs push people into buying high and selling low – exactly the opposite of what they should be doing.
Sector Classification in stock markets
As per our understanding from previous units, we know by now, the stock market works on the concept of sector rotation. It is one of the key strategies to be followed by any market participant to create wealth. Stocks reflect not just economic factors, but also government interventions and that may reflect into share prices of companies of that sector. Among the leading or lagging sectors, we often see the periodic rotation. This is like a relay race where the baton is passed from one sector to another among the overall leadership group as the market moves. Hence for a short-term trader too it is very important to keep track of how different sectors are behaving.
Sectors can be classified in different ways:
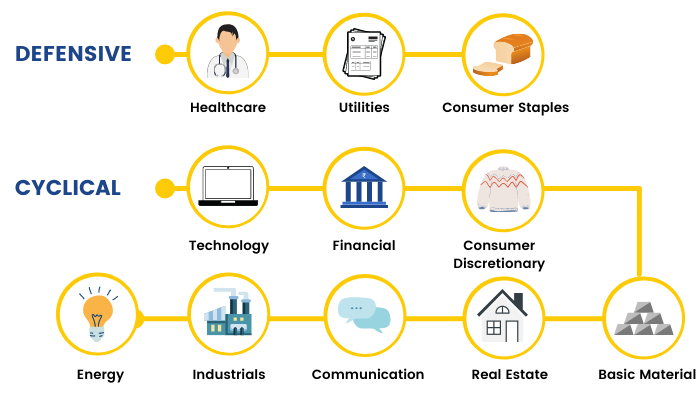
One way is grouping companies by the product and services they offer. For example, the firms that extract crude oil will constitute the Oil & Gas Industry. Firms can also be classified according to their sensitivity to business cycles. The sector which moves in accordance with the cycle is known as the cyclical sector and the one that is not impacted by the market cycle is known as a defensive sector/ non-cyclical sector.
Cyclical Sector: Stocks belonging to sectors such as Metals, Oil & Gas, Cement, Real estate, Capital Goods, etc. are known as cyclical stocks. The performance of these sectors are directly related to the economic cycle. If there is a market downturn, these sectors are the hardest hit. Similarly, these stocks are known for outsized returns in times of bull markets. Increased consumption, more production, more construction and infrastructural development propel these stocks to greater heights.
Defensive sector/ non-cyclical sector: Stocks belonging to sectors such as Utilities, Consumer non-durables, Pharma, IT are known as defensives. They are unperturbed by any downturn in the economic cycle. For instance, even if there is a recession, people do not stop or cut down expenses on utility services like electricity, healthcare services, consumer goods and other basic necessities. These stocks are known to outperform during periods of economic downturn and underperform during times of economic expansion.
Statistical methods such as Cluster Analysis can also be used for classifying stocks. In this method, firms that have historically high correlated returns are grouped together. However, this method has limitations because historical data might be biased.
Now the question may arise: How to track the broad market indices representing a particular sector?
The StockEdge App has been designed keeping the specific needs of varied investors now. It has become an indispensable toolkit for both traders and investors alike!
Real-time market data can be accessed using this link or the mobile application.
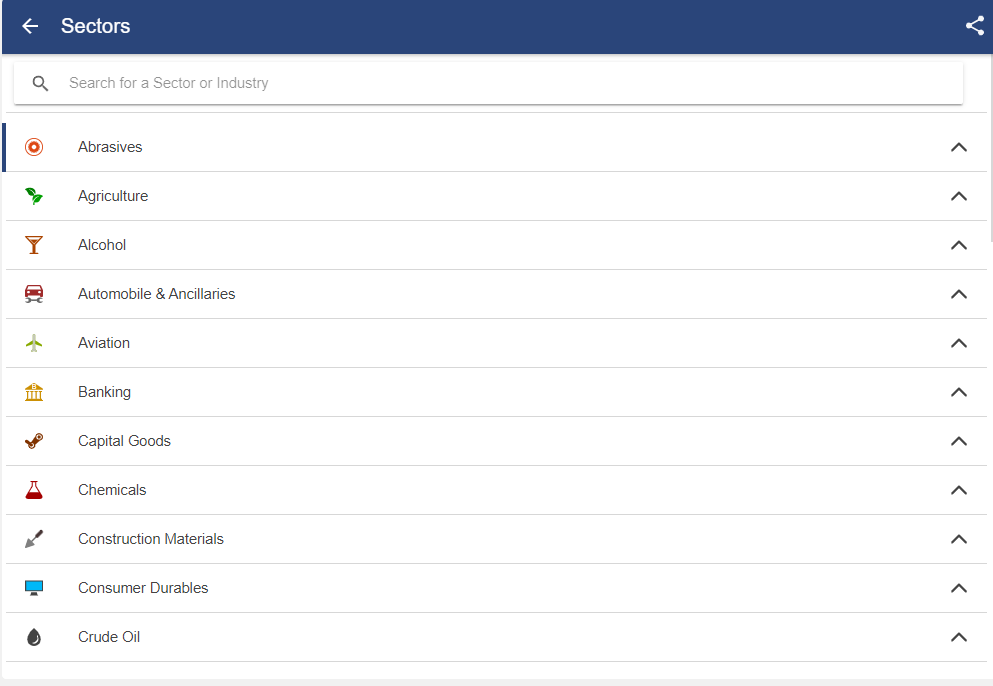
The StockEdge homepage:

After clicking on the highlighted icon, the following page shall appear. Herein, stocks have been categorized into forty-one divisions to help investors filter stocks based on their nature of business.
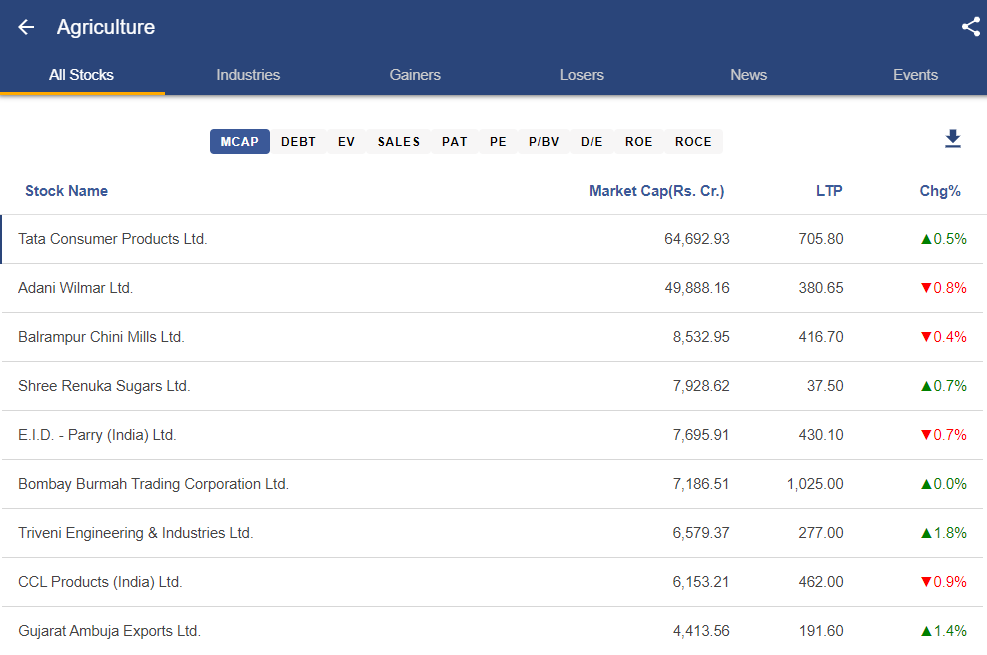
We believe that this feature will help a market participant to get a clear understanding about the performance of a particular sector as well as conduct advanced research by proper classification of stocks.
There is also a Commercial Classification System which includes the Global Industry Classification System developed by Standard & Poor.
Sectors and firm compositions used by the commercial providers are listed below.
1. Basic Materials:
A. Building Materials.
B. Chemicals.
C. Containers and Packaging.
D. Metals, Minerals and Mining.
2. Consumer Discretionary:
A. Automotive.
B. Apparel.
C. Hotels and Restaurants.
3.Consumer Staples:
A. Food.
B. Beverage.
C. Tobacco.
D. Personal Care Products.
4. Energy:
A. Energy Exploration.
B. Refining.
C. Production.
D. Energy Equipment.
E. Energy Services.
5. Financial Services:
A. Banking.
B. Insurance.
C. Real Estate.
D. Asset Management.
E. Brokerage etc.
Sector Rotation
The concept of sector rotation was briefly discussed earlier in this module. Here we will elaborate it to develop a better understanding of the same.
In the never-ending pursuit to hunt for the next multi bagger, portfolio managers and investors often forget how equities as a whole fit into economic cycles. Globally sector rotation is a highly used term. This term was initially coined by Mr. Sam Stovall, Managing Director of US Equity Strategy at CFRA.
Some investors seek to profit from changes in the business cycle by using "sector rotation strategy." A sector rotation strategy entails "rotating" in and out of sectors as time progresses and the economy moves through the different phases of the business cycle.
Stock Valuations imbibe an element known as forward earnings i.e. the stock prices today are not on the basis of past performance but future expectations of earnings. To put it in other words, The stock price of ABC corporation today is trading as per market estimates of its earnings one year from now discounted at the risk-free rate or cost of borrowing.
The sector rotation strategy calls for increasing stakes and investment allocations to sectors that are expected to prosper during each phase of the business cycle while under-allocating funds to sectors or industries that are expected to underperform. The goal of this strategy is to construct a portfolio that will produce investment returns and outperform the market.
What is sector rotation?
- Sector rotation is a top-down approach style of investing involving movement of money from one industry sector to another by anticipating the various stages of the economic cycle in an attempt to beat the markets.
- It is based on the assumption that certain sectors provide relative strength to different stages of business cycles and thus have the capability to outperform the markets.
- Sector rotation is similar to tactical asset allocation. Instead of investing in a particular asset class—such as stocks, bonds, or commodities—in order to take advantage of current market conditions, the investor constructs a portfolio using selected economic sectors or industries.
According to Peter Lynch, “If you are in the right sector at the right time, you can make a lot of money very fast.” However, the challenge here is to both correctly select sectors and correctly time the economic-cycle – this is a challenging task for most investors. According to Sam Stovall, the author of two books on the topic: ‘Sector Investing’ and ‘Standard & Poor’s Guide to Sector Investing’, different sectors gain in different phases of the economic cycle i.e. expansion and recession.
The image below shows the best performing sectors in different economic cycles:


As market participants we should understand the stock market dynamics and how it is linked to the monetary system. Previously, every stage in an economic cycle used to last for longer periods if we compare it with today’s world. The aggressive monetary policy adopted by central banks around the globe has considerably shortened the length of the market cycle. As a result, 2020 saw the shortest bear market on record. The surging liquidity around the globe gave a shot in the arm to asset prices.
The image below is a representation of some of the sectors which have been trending over the last few years:

The above image depicts that every sector has its own cycle and peaks and bottoms out during the different stages of an economic cycle. As we can see, Nifty Finance rose from FY17 to FY19. Nifty FMCG was booming from FY10 to FY13. Similarly, Nifty Metal has been the star of FY21.
To get started, you can use our Sector Rotation feature. It will help you track the current movement of sectors and identify the right sector to invest in.
Sector Identification
We have already learned that sectors rotate from time to time. But for investment purposes, it is essential to identify the right sector at the right time. So, let us learn how.
How to select the best stocks where the most profit can be generated while being in the right sector?
There are essentially two steps for successfully screening stocks:
1)Buy the Gloom, Sell the Optimism- Consider this is the holy grail for employing the sector rotation strategy. Investors must be courageous enough to slowly accumulate these stocks at times when the earnings are at their worst and the outlook is dim. Similarly, you should systematically exit your position at the peak of the cycle when long calls on the sector become a crowded trade and analyst upgrades continue to pour in every other day.
2)Ride the trend- Once you have identified a sector that is due for re-rating, you must hold onto the stock for a longer time period instead of selling it for a quick 10-15% gain. Once a sector breaks out of slumber, the potential for outsized gains is quite high. Let us understand this better with the help of an example:

The above graph shows the stock of Balrampur Chini Mills breaking out after a 16-year consolidation. We are considering an individual stock since there is no index to track the performance of sugar stocks in India.
Getting back to the topic, Investors will notice that once the stock broke out from its narrow consolidation range, it gave tremendous returns. As of 6th July 2021, the stock is at ₹345 which approximately implies a 70% return from the trendline level.
Booking profits is extremely critical and must be done in a systematic manner instead of squaring the position at the first signs of a bounce. For instance, you can square off a certain proportion of your position at fixed intervals (Reducing your position by say 15% after every 10% gain) Alternatively, you can make use of trailing stops.
And these phenomenal returns aren’t just limited to one stock, the entire sugar sector has been in a strong bull grip off late.
Track the Exchange Sectoral Indices - Sectoral indices give a snapshot and benchmarking data of certain sectors or industries. It allows investors to track how various sectors of the market are performing.
Overall, there is a general market consensus that the NSE indices are better constructed than those of the BSE, still investors can use their own discretion.
Examples of sector indices include energy, services, healthcare, consumer products, industrial, materials, utilities, technology & communications and financials. The price performance of a particular stock must be compared with the index to check whether the stock has outperformed/underperformed its peers. Similarly, a sectoral index can be compared with the headline indices (Nifty, Sensex)

The above image shows the performance of different sectors over a one-month period as on 29th April, 2021.
When we’re trading, our goal is to generate short-term profits and the in-depth understanding of any sector or company for that matter is not needed. On the contrary, if we are a long-term investor, we need to know the dynamics of the sector in and out. Additionally, we need some basic understanding of technicals to determine entry & exit points.
Below are the steps to trade in a sector:
A.The first step to trade using sector rotation is by finding a sector which is currently about to enter into/ is already in an uptrend.
B.After finding such a sector, we must stick to market leaders that have the potential to be the stars of the bull-run. The market leaders are not necessarily the ones with the highest market capitalization, but the ones who are best placed to reap gains in a sectoral upcycle.
Events and themes: There are a host of themes which can be capitalized in the stock markets each having its own specialized area to deal with. Each area in itself is a major threshold of an economic upturn for the economy as a whole. Themes pertaining to financial schemes lauded by the government or socio-economic policies which can not only shape the entire economy but can also change the way the society looks today, the COVID pandemic theme or the crude oil price rise – All these themes and events have specific impacts on sectors and stocks which can be easily identified.
Say for example: The Government of India’s Production Linked Incentive (PLI) Scheme gave a huge boost to the manufacturing sector. The stock of Dixon Technologies has been on a tear ever since then:

Similarly, the Covid Pandemic had a positive impact on the entire Healthcare sector and related stocks.
Management Guidelines: The Management and con-call analysis also helps an investor to identify the sector play. The strong and good companies release their con-call analysis and investor presentations every quarter. Going through them also gives a decent understanding about the sector in play.
Let us understand this with a particular example: We take the FMCG sector under which we will be studying about Dabur Ltd. Management & Discussion Analysis of Dabur Limited Annual Report 2020 states the following with respect to FMCG Sector Analysis
“The Fast-moving Consumer Goods (FMCG) sector is the 4th largest sector of the Indian economy. During FY 2019-20, the sector witnessed growth of 7.2% as per AC Nielsen, which is almost half of the 14% growth reported in FY 2018-19. “The sector saw a sharp slowdown during the year on account of moderation in economic activity, low farm incomes and weak rural wage growth, liquidity crunch in the system, high unemployment levels and down trading across categories. By March 2020, the sectoral growth dropped to 3.3% in value terms and 0.5% in volume terms. The Coronavirus pandemic has further impacted the sector since March 2020 due to restrictions on the movement of goods, supply side bottlenecks and impact on consumption. Consumers have been stocking up essential products such as packaged foods, staples, tea, coffee, milk, detergents and other products of daily usage. During this phase, demand has also surged for health and hygiene products as these aspects came into sharp focus. There was a surge in demand for hygiene products like sanitizers and disinfectants in addition to immunity building OTC (Over- The- Counter) and healthcare products. However, discretionary and nonessential items have seen weak demand as the focus during the lockdown has been on food and hygiene.”
The above extract clearly shows how the management report can give an idea about the entire sector slowing down. And the best part is how stock prices reflect the same. As a matter of fact, NIFTY FMCG Index has been the worst performer in the market bull-run after the COVID Pandemic struck.

Sector Rotation Strategy
Which Indicators can we use to trade using Sector Rotation?
In this section, let us now discuss some specific strategies which can be followed by a trader to identify and differentiate the strong outperforming sectors and the weak underperforming sectors.
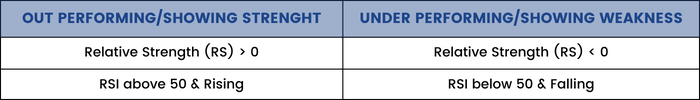
1.Relative Strength (RS) Indicator –
“Relative Strength is a ratio between two assets, most often a stock and a market average (index). To calculate the relative strength of a particular stock, we can divide the percentage change over a time period by the percentage change of a particular index over the same time period". This indicator oscillates around zero. If the value is greater than zero, the stock has been relatively strong during the selected period; if the value is less than zero, the stock has been relatively weak.”
It can also be used to find stocks that are holding up better during a broad market decline or showing weakness during a broad market advance.
We can create template charts with RS indicators for the sector index to determine the leaders and the laggards. Once the leading sectors have been determined, we can then look within these sectors to find the leading stocks. Sectors that show relative weakness can be avoided to help narrow the search. One thing to note is that the RS works better on cyclical sectors, or stocks that are very volatile in nature.
2.Relative Strength Index (RSI) –
Relative Strength Indicator or RSI is a momentum indicator which identifies stocks that are overbought or oversold in relation to their prices. The RSI oscillates between zero and 100. Traditionally, the RSI is considered overbought when above 70 and oversold when below 30. Signals can be generated by looking for divergences and failure swings. RSI can also be used to identify the general trend.
Note: Both the Relative Strength Indicator and the Relative Strength Index are different.
Strategy
Some Real-Life Examples
Let us discuss sector rotation with the help of technical charts. Here are some examples.
1. NIFTY AUTO:
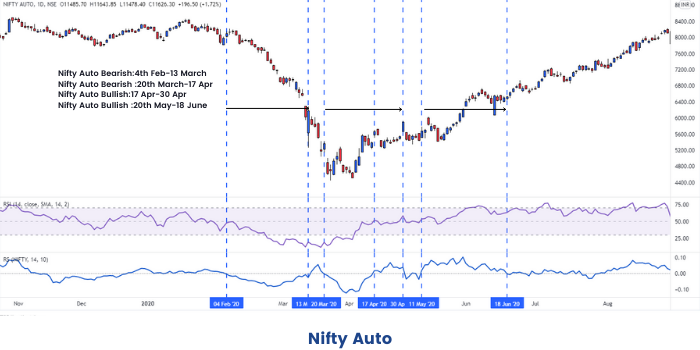
The above is the chart of NIFTY AUTO.
As we can see, from 4th Feb to 13th March 2020, NIFTY AUTO was in Bearish or downward trend, whereas the RS Indicator was less than zero, also showing a bearish trend in NIFTY 50. The RSI, also showed a bearish pattern during this time. Anyone looking to buy stocks in NIFTY Auto, should have waited until 17th to 30th April, when the 2 indicators, and the chart confirmed a positive trend.
2. Maruti:

Maruti, from the Automobile Industry, showed a positive trend from 26th May 2020. Whereas, RS was greater than zero, and the RSI was greater than 50, both confirming a positive trend. If we see, Nifty Auto was also in a positive trend from 27th May, 2020.
3. NIFTY FMCG:
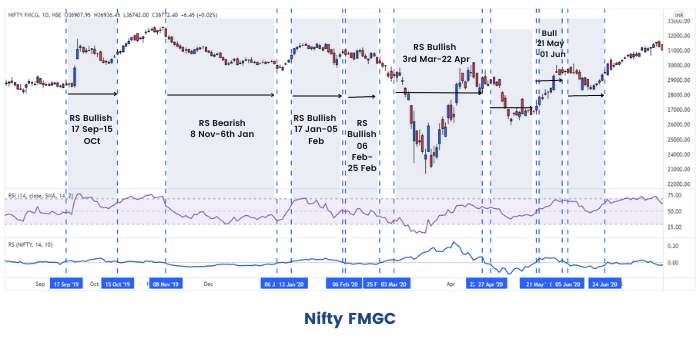
The above is a chart of NIFTY FMCG.
The Bearish Patterns were on 27th April to 20th May, and,
The major bullish pattern was from 3rd March to 22nd April.
The trends were also confirmed by the 2 indicators.
4. Hindustan Unilever:
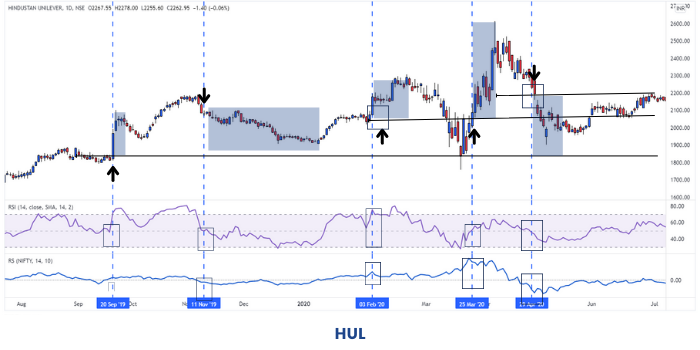
As we can see Hindustan Unilever, which belongs to the FMCG sector, also showed an upward trend from 29th March 2020.
Conclusion of Sector Rotation
We should understand that sector rotation is a broad topic. It is generally for value investors in which they need to use the top-down approach and analyze the sector and every piece of information that’s available about a company.
Tools such as Michael Porter’s five forces, Industry Concentration Ratio can all be used as supplement measures in Sector Analysis.
We should also note that government regulation can also play a huge role in the growth of a sector. The Real Estate Sector and the Power Sector are the sectors where new regulations are coming up regularly. These sectors may or may not provide huge growth opportunities in the future. Like all strategies sector rotation also has its own benefits and drawbacks.
Sector rotation, if done prudently could give investors the opportunity to ride the best period of a particular sector. Exit and entry point matters a lot in this strategy. Also, we must note a contrarian view on the sector could go wrong and leave investors in a soup.
Sector rotation strategy can help investors align their investments with their market outlook. With an understanding of how certain sectors react to the business cycle, investors may be able to optimally position their portfolio.


