Intermarket analysis
Introduction
Traditionally, an equity investor is taught to focus on either fundamental analysis of the company or technical analysis or both in order to find the right opportunity. However, earlier due to scarcity of information, this was sufficient to generate good returns.
Presently, the information is abundant. It is difficult to generate an alpha (higher return than the benchmark) by just focusing on fundamentals or technicals. Intermarket analysis equips traders & investors with the extra edge to beat the index.
Similarly, market manipulations are higher in the equity markets and affect the retail investors specifically. With the knowledge of intermarket relationships, you can get early warning signals or confirmations about the trend.
What is Intermarket Analysis?
Financial markets comprise four main asset classes: Stocks, Bonds, Currency and Commodity. The movement of each asset class has an impact, positive or negative on other asset classes. When you are analysing the science behind this relationship and utilizing the same in order to make your investment decisions, you are said to be doing an “Intermarket Analysis”.
Intermarket Analysis as a branch of Top-Down Approach
Intermarket analysis is a branch of Top-Down Analysis, so let’s first understand the different types of analysis, before delving deeper into the Intermarket Analysis.
Fundamental Analysis comprises of two branches of studies:
1.Top-Down Analysis
2.Bottom-Up Analysis
Both the approaches have a similar end result, i.e., investing in the ideal opportunity. However, the only difference is the sequence of study. Let’s understand this through the following infographic.

A top-down investor will do the majority of her research on the macro-economic indicators such as GDP growth rate, inflation or unemployment data, to reach a conclusion about the state of the global and domestic economy and conclude whether the time is optimal to allocate capital or not. Well, this is not all, once the state of the economy is defined, the top-down investor will select the most appropriate sector that can outperform the market. Once the majority of the work with respect to the macro analysis is completed, investors would move towards selecting a portfolio of stocks that best meets her criteria of investments. A good example of top down investment is when you select a thematic fund. A thematic fund is a mutual fund that own stocks that are selected on the basis of a particular theme. Say, you are bullish on the consumption pattern in India. In that case, you may select consumption funds provided by many asset management companies (AMCs). The NAV of the fund will go up as the consumption in India grows.
A bottom-up investor, on the other hand, would spend most of her time selecting the best stock and then move up the ladder to justify the purchase. For example, a bottom-up investor picks up Infosys as a prospective investment opportunity by looking at its fundamentals in detail and valuing the company. She would then move up the ladder in order to understand the economics of the sector, country and global economy.
A top-down investor would generally hold a more diversified portfolio than a bottom-up investor due to a lower focus on individual stocks.
Investors using the top-down approach, in-order to make sense of the fluctuation in the broader factors like GDP growth, inflation, interest rates, etc. have formed a template model called the Business Cycles and divided it into four different phases as shown below.

Therefore, each business cycle comprises four phases oscillating the economy between the booms (peak of Phase II) and recessions (trough of Phase IV).
We will discuss more on business cycle & Intermarket analysis in our next section.
Intermarket analysis and Business Cycles
The knowledge of business cycles will help you decipher the interconnection between asset classes. For example, a revival in the economy during Phase I would mean a positive outlook for the equity markets. A booming equity market generally suggests reducing investor’s risk aversion and hence the price of Gold subsides (gold generally rises during crisis periods).
Read through the subsequent sections to know more about the hows and whys of this relationship.
Importance of Intermarket analysis
Legendary technical analyst, John K. Murphy in his book Intermarket Technical Analysis, has famously quoted, “for us as traders and investors it is no longer possible to study any financial market in isolation, whether it's the U.S. stock market or gold futures. Stock traders have to watch the bond market. Bond traders have to watch the commodity markets. And everyone has to watch the U.S. dollar. Then there's the Japanese stock market to consider. So who needs intermarket analysis? I guess just about everyone”
A globalized world is interconnected and so are the financial markets. For some it might look like a hassle to study many markets but for those who understand the intermarket relationship it might be an opportunity. Imagine, you are able to guess the movement of stock markets just by looking at the interest rates, or say you can judge the movement of the Canadian Dollar just by looking at the prices of Gold. Wouldn't that make your life easy? You no longer need to hear out the market gurus on business channels and can base your investment or trading decisions systematically and independently. However, be cautious that intermarket analysis will not give you a specific buy/sell signal, it will however, provide you an efficient confirmation tool for trends and warnings for a reversal.
Whether you are an investor or a trader, whether you look at stocks or bonds, a commodity or forex trader, intermarket analysis will help you judge the movements of your favorite instrument and earn an edge that you have always been targeting. Also, it helps you to manage the risk by getting early warning signals.
Are Asset Classes Correlated?
Bond yields and stock prices are said to be inversely correlated. This means that an investor looking to buy equities, can get a confirmation via reducing interest rates.
Look how beautifully this has played over the long term in the US stock market returns and US Bond Yields.

Similarly, bond yields and commodities are positively correlated due to the common factor "Inflation" influencing both of them.
Notice how both CRB index (an index that tracks major commodity prices) has risen along with the bond yields. Hence an investor looking to buy commodities, can get a confirmation via looking if the bond yields are rising or not.

What Affects the Movements of Asset Classes?
Following our discussion of correlations of different assets, let us now examine factors that influence an asset's price movement.
Macro Factors influencing asset price movements
The following factors are the most commons ones, that would affect the movement of almost all the asset classes
1.GDP Growth Rate
Gross Domestic Product (GDP) is the sum total of all goods & services produced in an economy in a given time period. Whether you buy a pen from a stationary store or a car from an automobile store, all these transactions are accounted for under the GDP of a particular year. Since the economy is all about transactions and growth in transactions would necessarily mean a higher income. Hence for a top down investor, GDP growth rate is the closest estimate of economic health.
2.Interest Rate
When we talk about Interest rates, we generally refer to the yield of long term government bonds, more specifically the ten year maturity. As you would already know that interest rates impact the economy on the whole and therefore would have an indirect impact on all the asset classes. In case of bonds, interest rates have a direct impact and are usually inversely related. For example, a drop in interest rates would generally mean an increase in the bond prices.
3.Inflation
Inflation is the rise in the prices of the asset classes over a period of time. Suppose, today a dosa costs you ₹50 at the nearby Udupi restaurant, and the next year, the restaurant owner suddenly increases the price of dosa to ₹55. This means that the inflation in the price of dosa for the year is 10%. Obviously, while calculating the national inflation, Udupi dosas are not accounted for individually, however, the central bank tracks the prices of a basket of goods consisting of food, fuel, clothes, etc. to get an average price increase for the year.
Inflation is a necessary evil. While no one will like the price of her favorite Dosas rising every year, a falling inflation (called deflation) is even more undesirable as it would lead to deferment of purchase and impact the GDP figures negatively. An inflation which is within the range desired by the RBI (currently 2-6%) is considered healthy for the economy.
4.Corporate Profit and Unemployment
Corporate profit and unemployment are inversely related. When the corporate profitability goes up, it usually leads to a rise in employment activity. An upward trending corporate profitability graph and downward trending unemployment graph is desirable.
5.Investor sentiment
Sentiment is a very important aspect of the financial markets. With the rise in analytics and machine learning, various hedge funds have deployed strategies that buy and sell assets based on the sentiment analysis of the market. For example, if there is a trending discussion about a stock on reddit, the algorithm would judge the sentiment (positive/negative) and suggest trades accordingly.
Investor sentiment has a huge role to play in the market movement and momentum.
Business Cycle Affecting Macro Factors
Now you are aware about the major macro economic factors that you would require in the intermarket analysis. Let's now take a quick look at how these factors function in different phases of the business cycle.
You must have seen how a business cycle looks in the first section.
A complete business cycle can be analyzed on various timeframes i.e. short-term, medium-term & long-term However, with rising volatility and monetary intervention the cycles are becoming shorter in length
Phase I
Phase I is the early recovery of the economy post a recession. The GDP growth numbers are still low as the spending and investments are yet to kick in. Although the general demand is better than it was in recession, the inventory pile up with the businesses does not allow the inflation to kick in yet. RBI will not risk to raise the interest rates yet since the economy is still on ventilator. Interest rates in Phase I are either falling slightly or are bottoming out. The corporate profits have begun to pop up, however, unemployment is still high as companies are still operating at existing capacities. The retail investors are usually late to the party and in this phase they are out of the markets due to the fear of losing money and hence have a pessimistic sentiment towards risky assets like equity.
Phase II
Phase II is popularly called the accelerated growth phase. This phase is characterised by above average GDP growth rate. The demand is so strong that the existing supply of goods and services is no longer sufficient and hence leads to price rising (inflation). Business enthusiasm is at an all time high and managers give bullish guidance like margin and capacity expansion. Corporate profits are on a rise and so is hiring and thus reducing the unemployment in the country. Remember, RBI hates inflation when it exceeds its range. Although inflation is still under control, to stop it from exceeding the upper range, RBI will start raising interest rates. Investor sentiment is very bullish.
Phase III
This phase is the phase of stagnation or deceleration in GDP growth rate. There are signs of stress like high inflation and high interest rates. These all lead to lower corporate profits and institutions re-thinking about their hiring policies which crops up the fears of unemployment rising in the near future. Investors, especially retail investors continue with the FOMO (fear of missing out!) and are struck by buying assets at all time high prices.
Phase IV
The dust that started to rise in the previous phase (Phase III) will take the shape of a storm now. Phase IV is the ultimate recession, where none of the macro factors seems good. RBI cuts interest rates rapidly, however, the investment picks up only when the storm passes by and we again enter into Phase I.
The table below will brief you about how the macro factors move in various phases of the business cycle.

Once we are clear with the factors affecting different asset classes, now let us move towards exploring how various asset classes are interconnected.
Interrelation amongst various asset classes
Are assets correlated?- Yes, we already answered this question in Unit 3 of this module. But what is the interrelation among different asset classes? So, let's now try to answer this question here.
Interest rates vs Bonds
Bond prices are inversely related to interest rates. A rise in the interest rates generally means a fall in the prices of bonds. This is because the price of a bond, like any other asset is the present value of the future cash flows. Hence, an increase in interest rate will reduce the present value of cash flows, taking the price of the bond lower and vice-versa.
When we say generally, it means that sometimes, corporate bonds may rise or fall irrespective of the movement of interest rates. Say, for example, Jet Airways filed for bankruptcy. The price of its bond will fall irrespective of the level of interest rates in the general economy.
Barring such instances it is imperative to find the prices of bonds rising when interest rates in the economy fall or are expected to fall. Similarly, bond prices slump when the interest rates in the economy rise or are expected to rise.
Interest Rates vs Currency
Suppose you are a global investor looking to invest your money. You are given the following two choices:
(a)Either invest your money in a US Bond yielding 5%
(b)Or invest it in Indian Government bond yielding 7%
Where will you put in your money, provided you feel both countries are equally safe? Ofcourse, the country that is providing the higher interest rate, India in this example.
Therefore higher interest rates tend to attract foreign cash flows and since investors need to buy a currency in order to invest in assets denominated in that currency, higher interest rates tend to be associated with rising exchange rates. Resultant, keeping other things constant buy the currency of the country whose interest rates are expected to rise.

The US Federal Reserve (FED) began increasing interest rates in 2015. In 2018, however, it took the most number of increases (4) and raised it from 1.5% to 2.5%. Notice how this led to an increase in the dollar index as global investors found it lucrative to invest in the US rather than other countries.
Since bonds are inversely related to interest rates, solving the equation, we find that there is an inverse relation between bond prices and exchange rates.
Currency vs Commodity
Currency of the countries exporting commodities, are highly correlated to the prices of such commodities.
To understand this better, let's consider Australian Dollar (AUD) VS US Dollar (USD). Australia has the world’s largest gold reserves, with studies estimating that 17% of the world’s total gold reserves resides in Australia. Hence it is obvious to note that as gold prices increase, investors would pay Australian Gold miners in AUD to buy gold. This leads to a higher AUD vs USD.
The chart below shows the high correlation between Gold prices (black line) and AUD (blue line).
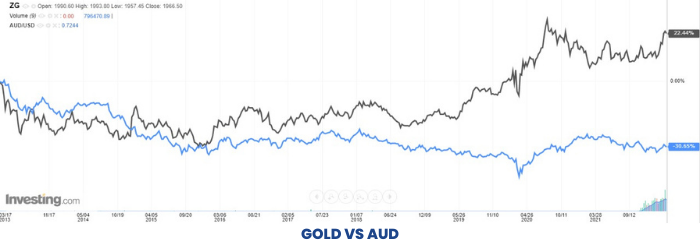
As can be seen from the chart, it is practically indifferent to buying gold or AUD as both are highly correlated.
The correlation between Canadian Dollar (CAD) vs USD and Crude Oil is also high. This is due to the fact that Canada is an oil exporter and benefits when the prices of crude oil are on the rise.
Resultant, an investor tracking a commodity rise, can alternatively buy the currency of the country which is the major producer of the same.
Bonds vs Commodities
Before moving to understand the relationship between bonds and commodities, let us first understand an important concept that drives interest rates.
The Drivers of Interest Rates
Interest rates are driven by 3 factors
(a)GDP growth rate
(b)Inflation rate
(c)Central Bank monetary policy
Let's derive the theoretical interest rate of the Indian economy through the following hypothetical numbers:
Suppose the 10 year expected GDP growth rate for India stands at 6%, 10 year expected inflation is 4%. This would mean that the 10 Year government bond (risk free) should be yielding 10% (i.e. 6% + 4%).
However, the market price of the bond is trading at 9%. Here comes the plug-in figure of -1%. This means that the RBI’s monetary action is keeping interest rates lower by 1% “artificially”.
Hence the prices of interest rates can be affected by any of three factors listed above.
Coming back to understanding the relationship between Bonds vs Commodities.
A rise in commodity prices signals inflation. And remember what rising inflation does to interest rates? Interest rates rise with rising inflation and as bond prices are inversely related to interest rates, bond prices fall.
As a result, since Commodities are inversely related to Bond Prices, an investor should theoretically sell bonds when commodity prices pick up.
In the practical world, you should be aware that intermarket relationships give you a signal about the trend or warning about a reversal. Hence its advisable to look out for technical breakouts in the respective charts along with analysing intermarket relationships before taking a trade.
Intermarket Analysis for Retail Stock Market Investor
Why Does an Equity Investor Need To Know About Other Asset Classes?
The knowledge of intermarket relationships, can get you early warning signals or confirmations about the trend.
Lets understand this through an example, gold is said to be inversely related to stocks. Therefore if you think the economy has entered Phase I (remember Business Cycle?), and feel that demand would come back and hence equities should be the favoured asset class. Alternatively, you may have seen a break out in the Nifty 50 index chart and feel that it will trend higher. A confirmation of this can be seen with sideways or down trend in the gold prices. When you have gotten a confirmation about your thesis, it generally has a lower failure rate and you can allocate higher towards equities or pull out/short gold.
Once you are aware of why to use intermarket analysis in your investment or trading decisions, let's now move on to see the factors affecting equity markets.
Factors Affecting Equity Markets
1.Corporate Profits
A stock price is derived by multiplying the earnings per share to the Price to Earnings Ratio (EPS * PE = Stock Price).
While many of us would believe that the prices of most quality companies have been possible only due to PE expansion, let's look at the following data to confirm our thesis.

The table shows the return breakup of the price change. The Times change in PE * Times change in EPS is approximately equal to the Price Change (Times).
Let's interpret Kotak Mahindra Bank’s (Kotak) return. Kotak’s share price has risen 756 times over the last 20 years. Out of this a 67 times of rise was due to EPS expansion and the remaining 12 times was due to PE change.
Similarly, it can be seen that for the top 10 quality companies, the EPS change has been a more dominant force than the PE change.
Hence, corporate profits can not be neglected as a major factor driving the returns of equities.
2.Market sentiment
Another important factor determining the stock returns is the market sentiment. An estimate of the market sentiment can be taken through the PE expansion or contraction. A PE expansion of a stock is generally seen as a positive sentiment and hence drives the stock price higher. A PE contraction on the other hand can be seen as a sentiment damper and hence drives the stock price lower.
Technical analysis can also be used to judge the market sentiment.
3.GDP growth rate
Companies work within the nation and mostly cater to the demand of the nation. Hence it is obvious to note that if the nation grows, so will the company's profits and consequently the market cap. The scenario of higher GDP growth rate is witnessed during Phase I to Phase II of the business cycle.
Hence there is a positive correlation between GDP growth rate and stock prices.
4.Inflation
Inflation is surprisingly positively correlated to the equity returns. However, the correlation is not symmetrical. See the following table:

(Source: https://fred.stlouisfed.org/series/INDCPIALLAINMEI)
R squared is the correlation coefficient signifying the strength of correlation between two variables. The value of r squared ranges between +1 to -1. A positive number signifies positive correlation whereas a negative number would suggest that the two variables move in opposite directions.
Here, we have the 20 year correlation between the inflation (CPI - India) and annual returns of Sensex, Hindustan Unilever (HUL) and Tata Steel are calculated.
It can be seen that although all these have a positive correlation with inflation, however, the degree varies between Tata Steel and HUL.
Tata Steel directly sells the commodity products that are iron and steel and gets benefited through higher prices.
HUL on the other hand may or may not benefit. It will only benefit through inflation if it is able to take a price increase higher than the increase in prices of its raw materials.
When inflation rises above the desired levels, chances of an equity market downfall increases. This was experienced in 2008 when RBI’s inflation target range was 5.1-6.2% during the start of 2008
(https://www.rbi.org.in/SCRIPTS/PublicationsView.aspx?id=11302) and when the actual inflation numbers crossed 8.35%, a severe fall in the equity market was experienced with Sensex falling 52% during that year.
It has been witnessed that during Phase I and II, inflation growth is in the healthy range and hence supports equities.
In a broader sense, inflation which is within the Central Bank’s target range gives a boost to equities and vice-versa.
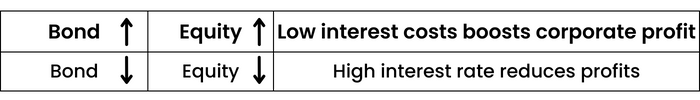
5.Interest Rates
Interest rates play dual roles in defining the stock returns:
a.Interest rate influences the cost of borrowing for the company. A higher interest rate causes the loans to get costlier and hence affects the solvency of the firm. On the contrary, a lower interest rate boosts the profits of the firm as the interest expense reduces.
b.Interest rate is an important tool in calculation of the intrinsic value of a company through discounted cash flow analysis. A lower interest rate boosts the value of the firm and hence results in an increase in the share price.
From the above two roles, it can be concluded that stock prices are inversely related to interest rates.
However, one with the knowledge of business cycles can argue that Phase I and II corresponds with an increase in interest rates and stock prices both. Hence, the interest rate factor should not be seen in isolation and should always be connected with other factors like GDP growth rate and inflation.
This complexity can be solved when one understands the drivers of interest rate. As explained earlier, interest rate is the sum total of GDP growth rate, inflation and the central bank's monetary actions (a plug-in figure). In understanding the role of interest rates on stock markets, the following thumb rule helps.
If the effect of GDP growth rate on interest rate is higher than inflation, we are in Phase I-II of the business cycle and hence equities will rise.
If the effect of inflation on interest rate is higher than GDP growth, we are probably in Phase III of the business cycle and hence equities shall fall.
Analyse Inter-relationship between Stocks and Other Asset Classes
By now you have understood how equities move and from earlier sections you have a basic understanding of how various asset classes react to each other.
Let's now move to learn how other asset classes like Bonds, Commodities and Currencies impact Equity returns.
Stocks vs Bonds
Bonds and stocks are positively correlated since both stocks and bonds are inversely related to interest rates.
Rising bond prices (due to falling interest rates), make it cheaper for the corporates to borrow. This helps them to improve their bottom line and hence the corporate profits.
Our earlier discussions showed how growth in corporate profit has a positive impact on the stock price returns. Therefore, rising bond prices are a direct indicator for stock prices to rise.
Similarly, a falling bond price (due to rising interest rate) would make it costlier for companies to borrow hence dampening the bottom line. This would lead to lower stock prices. Therefore, you should expect a fall in stock prices in case the bond prices have started to fall.
Case Study - IL&FS Crisis
Somewhere around September 2018, the dark clouds of defaults had started to take the shape. The first burst among the series of defaults was IL&FS. This led to a series of defaults by Dewan Housing, Yes Bank, IndiaBulls Housing and many more.
Interest rates reflect the risk premium over the risk free rate. This premium is referred to as credit spread and is calculated as the difference between a corporate bond yield and a government bond yield of the same maturity. In case of such big defaults it was quite obvious that the risk would increase and consequently hike the credit spreads.

As shown in the above graph, the credit spreads were in a narrow range of 50-100 bps during April-September 2018. Post the unfolding of the IL&FS crisis , the credit spreads shot up to more than 150 bps.
A similar trend was seen when the government announced the first lock-down somewhere during March-20.
Lets see if we could have benefitted by this data in our equity trades.

From the period of September 2018 till October 2018, The SENSEX corrected by approximately 15%.
The rise in the bond yields led to falling bond prices. Since equities are positively correlated to bond prices, a similar trend was seen in them.
Stocks vs Commodities
A rise in commodities has a direct impact on inflation and it starts to rise.
Remember, equities are directly proportional to inflation. However, not hyperinflation. In the previous segments we discussed that only the inflation that is within the target range of RBI is healthy and beneficial for stocks.
Or, if commodity price increase is sustainable with the growing income, it will generally lead to higher equity prices.
What if commodity prices rise more than the income increase, which is mostly the case in a commodity bull cycle. In such cases, inflation is probably dominating the interest rate increase (hyperinflation) rather than GDP growth. This is particularly seen in Phase III. In such cases, equity markets react negatively and fall.
Case Study: Crude at All Time High (2012-2013)
Brent crude rose to an all time high of USD130 per Barrel led by European debt crisis and Civil War in Libya during 2011-13. See in the below chart, how an above average inflation in crude oil prices led to SENSEX shredding in valuation.
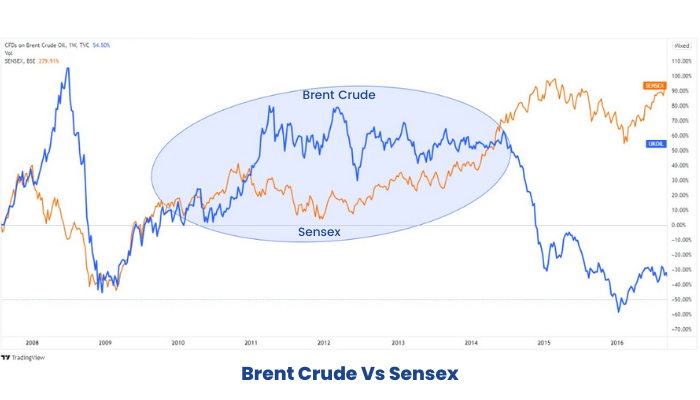
In the chart, you can also notice how SENSEX kept on rising once the supply of Crude oil increased and prices suppressed post 2014.
Therefore, an abnormal increase in commodity prices leads to fall in equities as that indicates falling purchasing power (inflation).

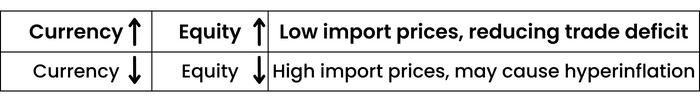
Stocks vs Currency
Currency has a direct bearing on commodity prices.
For a commodity importer country, devaluation of currency means higher commodity prices. This makes the environment conducive for runaway inflation (read, inflation exceeds RBI’s target range) and the ultimate diminishing of stock valuations.
Conversely, a rise in the currency of a country would mean lower import prices. Such instances would cool down the inflation (read, inflation is in RBI’s target range) and hence lead to a rise in equity prices.
However, a clear cut relationship between stocks and currency prices is difficult to state. In the above example, say the commodity importer country, would also be a service exporter, like India. In that case if India’s currency becomes too strong against counterparty countries, this would make its services costlier and hence India might lose its cost competitive advantage against other countries. In such cases, the fall in GDP might outweigh the inflationary advantage with falling commodity prices and consequently stock prices might fall.
Lastly, remember, intermarket analysis is not a method that will give you specific buy or sell signals. However, it does provide an excellent confirmation tool for trends and will warn of potential reversals.
Timing the Markets According to Business Cycles
In this section, let's understand when a particular asset class performs at its best.
In our study we have taken a business cycle ranging from October 2002 to March 2009. Within the business cycle the four phases were divided as follows:
Phase I: October 2002 to June 2004
Phase II: June 2004 to June 2006
Phase III: June 2006 to August 2007
Phase IV: August 2007 to March 2009
The cycles post the recession of 2009 were very short. The main reason is monetary intervention. However, in each and every cycle, no matter how short it is, being in the below mentioned asset class should be profitable due to the inherent macro factors shaping the phases.
Equities
Equity markets perform the best during Phase I of the business cycle. Let us understand why?
Equities as we know are the riskiest asset class due to its nature of receiving the residual claim. This means at the time of bankruptcy, an equity shareholder will receive the money, only after the claims of all the other stakeholders like creditors, banks and even the government are settled. Therefore at the time of recession, when the probability of bankruptcy is at its peak, investors sell equities at throwaway prices. This leads to panic selling and share prices are at dirt cheap levels.
Now once the dust is settled, that is the economy starts to experience green shoots in Phase I, investors should hop on to buy the equities. The risk of the economy slipping back into recession might be there, however, it is priced into the stock valuations.
Let's look at how the asset classes have performed in Phase I.

Commodity
Commodity prices are directly linked to inflation and industrial demand. Hence, the prices of commodities rise when the demand exceeds supply. We know from our earlier discussion on business cycles, that demand exceeds supply during the Phase II of the business cycle and hence the commodity prices will rise at its best during Phase II.
Phase III also experiences a rise in the commodity prices, sometimes higher than the levels seen in Phase II. Since inflation is still dominant it supports the price rise, however, dampening industry sentiments.
Phase III suggests that we should exit long positions from commodities during this Phase.
The following data table supplements our study.

Bond
Bonds are inversely related to interest rates. Bonds will outperform only when interest rates reverse.
Our understanding of business cycles tells us that interest rates are on a rise at least till Phase II of the business cycle. Phase III however initiates with a peaking of interest rates. Hence it can be considered that bonds outperform in Phase III and IV of the business cycle.
Within bonds, corporate bonds (investment grade) are the ones that outperform in the Phase III. This is because with falling interest rates in phase III, investors prefer to invest in Bonds rather than equity. Investment grade companies have higher solvency and are not expected to go burst in case of a recession.
During Phase IV or recession, investors should prefer government bonds. This is because during Phase IV the business environment is quite suppressed while RBI will keep on reducing the interest rates at a faster pace in order to stimulate the economy.
The following graph reinstates our study on the business cycle.

Notice the negative bond yield graph signifies reduction in interest rate which means that government bonds must have increased during this period. This is in comparison to equity and commodity asset classes which fell.
Conclusion
“History never repeats itself, however, it often rhymes” ~ Mark Twain
There may be certain instances, where you’ll find some of the relationships not existing. In that case, delve deeper to understand the factors better.
A recent example may be the increase in the yield of US10 Year Government Bonds from a low of 0.53% in August 2020 to 1.35% in June 2021. Normally, such a rapid increase should have led to a drastic fall in S&P 500. However, the opposite happened. S&P 500 instead climbed ~25% in the same period.
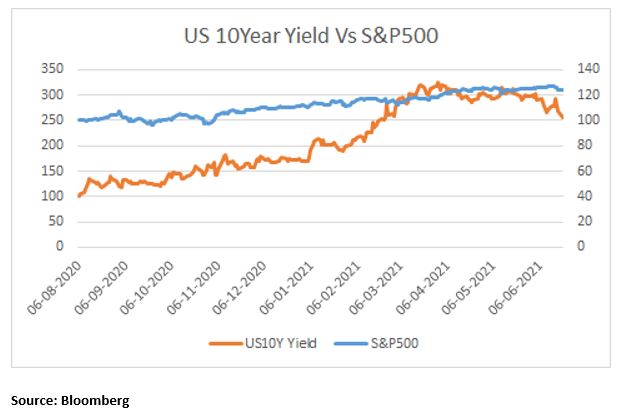
The reason for this anomaly was growth expectations driving interest rates rather than inflation fears.
Hence, in Macroeconomics nothing is conclusive, and cause and effect relationship has to be seen in order to find evidence of a movement in asset class.
A person studying intermarket analysis must not regard this as a mathematical formula. What is important is the knowledge of why the relationships exist in the first place.
Another important factor to keep in mind is that intermarket analysis should be considered as a signalling mechanism and not a decision mechanism. It has the capacity to give you signals or warnings, based upon which you may take your investment or trading decisions.
It might look complicated to start with, but hey, as Charlie Munger puts it, “Investing is simple, but not easy"!


