Introduction
This module will provide you with a basic understanding of stock investing. It takes a ground-up approach that will help you to analyze stocks for investment. It talks about financial statements so that you can learn to interpret the financial performance and health of a company. Additionally, we also guide you to perform fundamental analysis on any company. So, let us get started and understand the concept of fundamental analysis in the next unit.
Fundamental Analysis
What is Fundamental Analysis and stock investing all about?
Fundamental Analysis is a technique which attempts to determine a security's value by focusing on underlying factors that affect a company's actual business and its future prospects. It refers to the analysis of the economic well-being of a financial entity as opposed to only its price movements.
Fundamental Analysis Involves:
- Gathering, analyzing, interpreting company, industry & economic information
- Completely analysing a company's financial statements and finding out their implications
- Performing a bias free valuation in order to come up with a fair value (intrinsic value) of a stock and see whether it is under or overvalued.
What are the Goals of Fundamental Analysis?
- To determine the fair value of a company.
- To evaluate management integrity and internal business decisions
For whom Fundamental Analysis is relevant?
Fundamental Analysis is relevant for -
- Long term investors
- Fund managers
- Financial advisors
- Value Investors
Primarily there are two factors through which fundamental analysis are made- Qualitative & Quantitative. We will go through each of them in the upcoming units.
Qualitative Factors
What are the Qualitative factors which affect stock investing?
Qualitative factors are based on the quality or character of something, often as opposed to its size or quantity. It mainly involves understanding those aspects of the business that are not associated with numbers, i.e. the intangible factors which cannot be quantified but needs to be taken under consideration while analysing a company. Before diving into a company's financial statements, it is very important to look at the qualitative aspects of the company. In this section we are going to highlight some of the company-specific qualitative factors that one should be aware of when performing fundamental analysis.
The different types of qualitative aspects we consider are:

- Business Model:
Even before an investor looks at a company's financial statements or does any research, one of the most important questions that he should ask is; what exactly does the company do? This is referred to as business model- it's how a company makes money.
In simple terms, a business model is referred to as from where does the cash flows into the company. The total revenue of a company producing only one product A is the product of 'P', the price it charges for 'A' and 'Q', the number of units of A it sells. Thus, the total revenue is equal to 'PQ'. The business model primarily refers to understanding how much of the product 'A' that the company is producing and how much quantity 'Q' of A is it able to sell depending on its control of the price 'P'.
Sometimes business models are easy to understand. Take McDonald's for instance, which sells burgers, fries, soft drinks, etc. It is a simple model, easy enough for anybody to understand.
On the other hand, some business models can be very complex. For example, the business model of Reliance Industries is extremely difficult to understand because they have a number of business segments like refinery, oil & gas exploration, chemicals, etc. Understanding a particular segment would require an in-depth knowledge of each of the products and their complex functioning.
You should at least understand the business model of any company you invest in.
Thus, unless you understand a company's business model, you don't know what the drivers are for future growth and you leave yourself vulnerable to being blindsided.
As Mr. Buffett rightly says- "If a business does well, the stock eventually follows"
Discover the winning formula for mastering stock investing with our 'Stock Market Made Easy' course. Enroll now for financial success!
- Competitive Advantage:
A company's long-term success is largely driven by its ability to maintain a competitive advantage - such as Coca Cola's brand name and Microsoft's domination on the personal computer operating system. It creates a 'moat' around a business allowing it to keep competitors at bay and enjoy steady growth and profits. An economic moat is a term coined by Warren Buffett, which is the competitive advantage that one company has over other companies in the same industry.
The competitive advantage depends largely on the ambit of the moat. By having a well-known brand name, pricing power and a large portion of market demand, a company with a wide moat possesses characteristics that act as barriers against other companies that are eager to enter the industry.
When a company can achieve a competitive advantage, the shareholders of that company are rewarded for decades. This is clearly the case of the top multi-baggers of the past. From the likes of Hindustan Unilever to Pidilite Industries, each of the companies have huge brand equity and pricing power. These companies have created great shareholder wealth.
- Corporate Governance:
This is the framework of rules, practices, and processes that direct and control the firms as well as involves balancing the interests between management, directors, and stakeholders. Investors should always invest in companies that operate ethically, fairly, transparently, efficiently and whose management respects its shareholders' rights and interests. They should ensure that the communications made to them are clear, transparent and understandable.
Investors must avoid companies that benefit at the cost of the minority shareholder.
We would recommend going through our Corporate Governance module to get a better hang on this topic.
- Management:
Just as an army needs a general to lead it to victory, a company relies upon its management to steer it towards financial success. Some believe that management is the most important aspect for investing in a company. It makes sense - even the best business model is doomed if the leaders of the company fail to properly execute the plan.
It becomes crucial for an investor to analyse management integrity so that he/she can avoid wealth destroyers such as Yes Bank & Suzlon.
Retail & Individual investors are at a disadvantage as compared to professional investors in this case. You cannot set up a meeting with the management if you want to invest a few thousand rupees. On the other hand, if you are a namesake fund manager, there is a good chance you can schedule a face-to-face meeting with the upper management of the firm.
Every public company has a corporate information section on its website. Usually there will be a quick biography on each executive with his or her employment history, educational background and any applicable achievements. However, this information is hardly useful because we are looking for red marks in the company's management and no company is going to put negative information on the corporate website.
Instead, here are a few ways for you to get a better grasp:
- Conference Calls:
The Chief Executive Officer (CEO) and Chief Financial Officer (CFO) host quarterly conference calls. (Sometimes, you will get other executives as well.) The first portion of the call is management reading off the financial results. What is interesting in the con-call is the question-and-answer portion during the call. This is when the line is open for analysts to call in and grill the management over its performance as well as future plans. Answers to these queries can reveal a lot about the company. Now the thing to judge here is, do they avoid questions, like politicians, or do they provide the right answers?
- Management Discussion and Analysis (MD&A):
The Management Discussion and Analysis is found in the annual report. In theory, the MD&A is supposed to be a frank commentary on the management's outlook. Sometimes the content is worthwhile; other times, it is boilerplate. One tip is to compare what management has said in past years with what they are saying now. Is it the same material rehashed? Whether the strategies are actually being implemented? If possible, sit down and read the MD&As of the last five years; it can be illuminating.
- Ownership and Insider Sales:
If company's top promoters or managers are continuously reducing their stake in the company quarter after quarter, this is a big red mark on the company's fundamentals. This was precisely the case with Satyam Computers in India where the promoters' stake fell from around 30% to a mere 4.5% over the course and time and what happened next is known to all.
- Social Media buzz:
Although not exactly a reliable source of information, it can prove to be quite useful when the company is not actively engaged with the shareholders. Market commentators have interesting insights to offer on the business that can add value to your decisions.
Quantitative Factors
Since, we have discussed all qualitative factors of stock investing in the last section. Now, let us learn the different quantitative aspects of stock investing.
What are the Quantitative Factors affecting the stock price?
Quantitative Factors are ones which are capable of being measured or expressed in numerical terms. In our context, quantitative fundamentals are numeric, measurable characteristics about a business. We can extract numbers such as revenues, profits, assets, liabilities and other key metrics of a company from its financial statements.
The different types of quantitative factors we consider are:
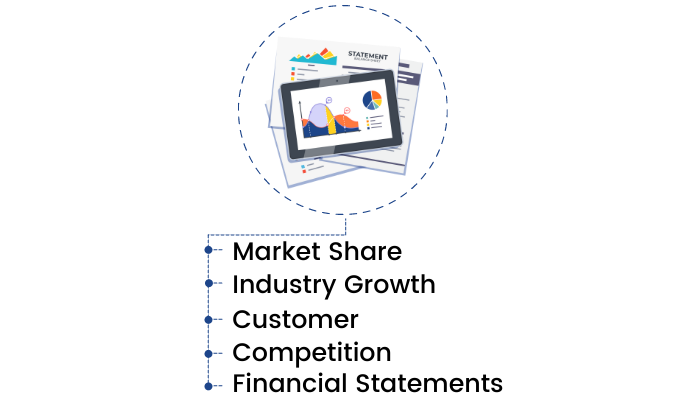
Market Share:
The market share of a company is the percentage or proportion of the total available market or market segment that is occupied by a company. This market share is denoted as company's sales revenue (from that market) divided by the total sales revenue of all its peers. It can also be expressed as company's sales volume(In a market) divided by the total volume of units sold in that market.
Understanding a company's present market share is crucial for a better understanding of the company's business. The fact that a company possesses an 85% market share tells you that it is the largest player in its market by far. Furthermore, this could also suggest that the company possesses some sort of "economic moat," in other words, a competitive barrier serving to protect its current and future earnings, along with its market share.
A company, which continuously gains market share over its peers, performs well in the long-term and creates shareholder value.
Industry Growth:
One way of examining a company's growth potential is firstly to examine whether the number of customers in the overall market or the industry is growing or not. This is consequential because without new customers, a company has to steal market share in order to grow continuously.
In some industries, there is zero or negative growth, for example, Power & Paper sectors are growing at a snail's pace and thus the stocks in the sector have not generated extraordinary returns for shareholders (leaving few exceptions). On the other hand, sectors like FMCG, Pharma, IT, etc. have grown consistently and are expected to continue this performance for the next foreseeable future and the same can be inferred from the stock performance.
Customer:
Some companies serve only a handful of customers, while others serve millions. In general, it's a red flag, if a business relies on a small number of customers for a large portion of its sales because the loss of any single customer could dramatically affect revenues.
For example, think of an arms supplier that generates 100% of its sales from the Indian government. Any change in the government policy could potentially wipe out all its revenues. For this reason, companies will always disclose in their annual reports if any particular customer accounts for a majority of revenues.
Stocks of most of the small Indian IT companies fell drastically with the advent of Global Financial Crisis (GFC) as their clients in the US started filing for bankruptcy.
This is because most of the smaller Indian IT companies had high client concentration in the US. However, the sector leader Infosys & TCS were fairly resilient since they had a diverse client base.
Competition:
Simply looking at the number of competitors goes a long way in understanding the competitive landscape for a company. Limited barriers to entry and a large number of competing firms create a difficult operating environment for a company and subsequently lesser value for shareholders.
One of the biggest risks within a highly competitive industry is pricing power. Suppliers lack pricing power in competitive environments and hence cannot command higher margins.
Financial Statements:
After looking at all the above-mentioned qualitative and quantitative factors, the most important aspect of fundamental analysis is the financial statements analysis of a company. A financial statement of any company is its report card which shows how a company has fared in the last quarter/year and whether or not it has made money. The financial statements are used by all the stakeholders of the company while analyzing a company. So, let us understand the concept of financial statements in the next unit.
Financial Statements
What are Financial Statements?
Financial statements are the medium by which a company discloses information concerning its financial performance. A financial statement of any company is its report card which shows how a company has fared in the last quarter / year and it is the most important aspect of fundamental analysis. It quantifies the company’s performance, strength, liquidity & profitability.
The numbers in a company's financial statements can be bewildering and confusing to many investors. However, if we know how to accurately analyse & interpret them, the financial statements are an ocean of information.
If you can develop a grasp of the definition of the balance sheet and the structure of an income statement, it would help you identify the "red flags" and "gold nuggets" of a company.
Three most important financial statements are:
- Income Statement
- Balance Sheet
- Cash Flow Statement

Ready to master the stock market? Enroll now for 'Stock Market Made Easy' and simplify financial statements like never before!
We will go through each of the financial statements in our upcoming units
Income Statement
In our last unit, we learned that fundamental analysis entails three primary financial statements- income statement, balance sheet & cash flow statement. So in this unit, let's begin with the income statement.
The Income Statement shows the financial performance of a firm over a specific accounting period. Financial performance is assessed by giving a revenue and expenses breakup through both operating and non-operating activities.
The income statement is a document important to managers, investors and other stakeholders alike as it contains vital information about the company. The income statement denotes whether a company has incurred profits or losses over a given time period.
The different components of an Income Statement are: -
- Revenue
- Other Income
- Expenses
- Net Profit
A sample Income statement of XYZ Company:

Balance Sheet
Previously we have discussed the income statement & its components. In this unit, we will discuss balance sheet.
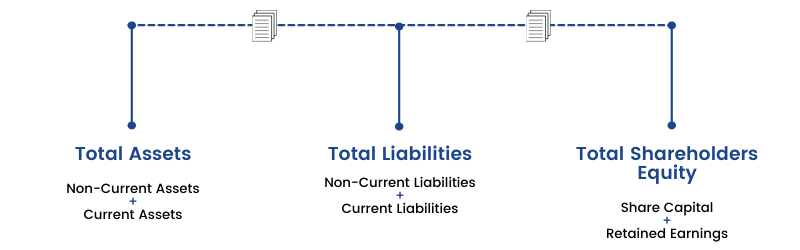
A Balance Sheet highlights the financial condition of a company. It offers a snapshot of the company's health. It tells us how much a company owns (assets) and how much it owes (liabilities) at a particular period of time. The difference between what it owns and what it owes is its equity, also commonly called "net assets" or "shareholders equity".
The balance sheet is named by the fact that it represents a business' financial structure balances in the following manner:
Assets = Liabilities + Shareholders' Equity
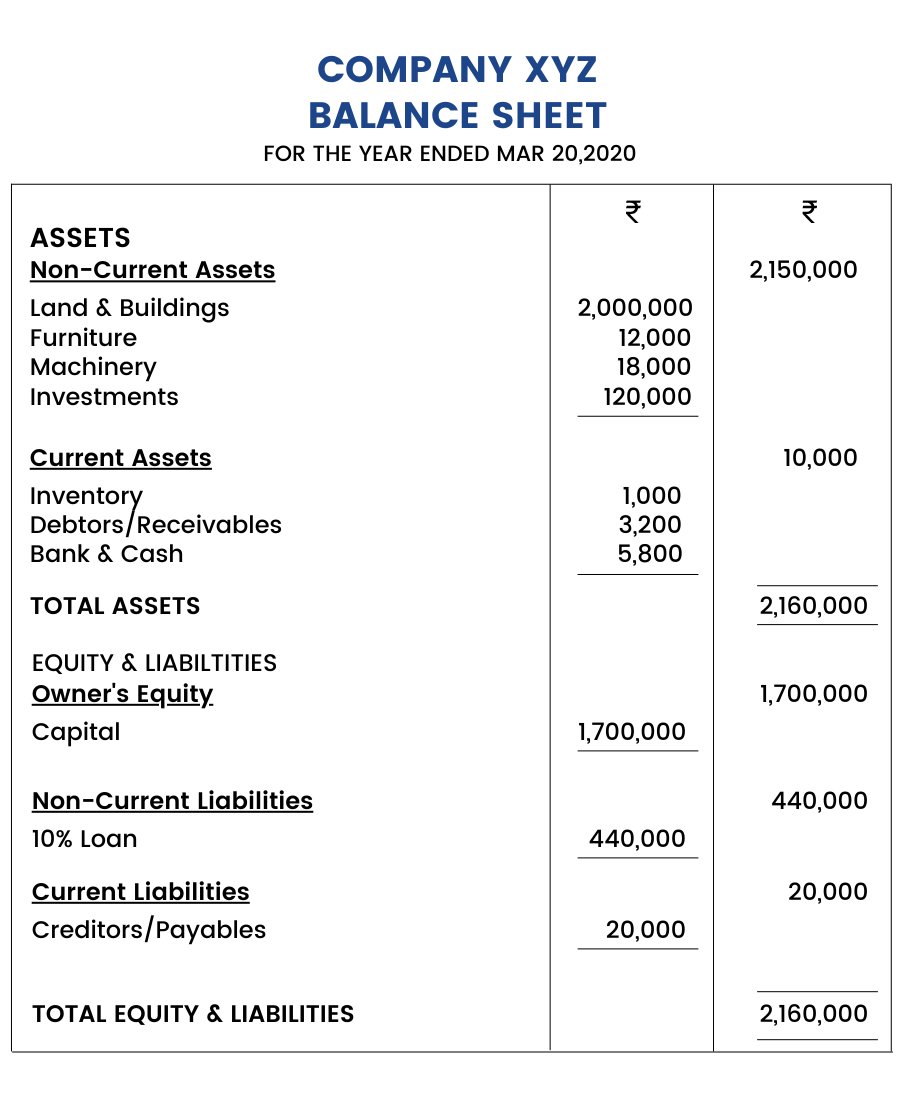
A balance sheet of a company provides the users of financial statements with a lot of critical information. This information must be carefully drawn to various conclusions about the financial health of a company. Understanding and analysing the balance sheet data is an integral part of financial analysis as a whole.
A sample Balance sheet of XYZ Company:
Cash Flow Statement
We will now discuss cash flow statements after covering income statements and balance sheets previously.
Cash Flow statement is a document that provides aggregate data regarding all cash inflows of a company from both its ongoing operations and external investment sources and all cash outflows on account of business activities and investments during a given quarter or year.
A cash flow statement shows the cash or liquidity position of a company.
It provides information regarding the following:
- Company's cash receipts and cash payments during an accounting period
- Information about the company's operating, investing and financing activities
- An understanding of the impact of accrual accounting events on cash flows
As an analyst, one should use the cash flow statement to determine whether or not:
- Regular operations generate enough cash to sustain the business
- Enough cash is generated to pay off existing debts as they mature
- The firm is likely to need additional financing
- Unexpected obligations can be met
- The firm can take advantage of new business opportunities as they arise
Companies generate and exhaust cash in several ways, hence, the cash flow statement is divided into three sections:
- Cash flows from operations
- Cash flows from investing
- Cash flows from financing
Cash Flows from Operating Activities:
This includes transactions from all the core or operational activities of a business. It shows how much cash comes from sales of the company's goods and services, less the amount of cash needed to produce and distribute those goods and services.
Companies that manage their working capital requirements efficiently, manage to generate positive cash from operations. This helps them to plan for Capex or Acquisitions for future wealth creation.
Example of cash flows from operating activities:

Cash Flows from Investing Activities:
This section largely reflects the amount of cash the company has spent on capital expenditures, such as new equipment or anything else needed to keep the business going. It also includes acquisitions of other businesses and monetary investments. It shows the cash flows that arise from investing gains or losses. It also provides information on changes in the company’s capital expenditure (CAPEX). If Cash Flow from Investing Activities is negative it signifies that the company is on an expansion spree & investing in the business.
Example of cash flows from investing activities:

Note: Interest received can be included under cash flows from interest activities or financing activities.
Cash Flows from Financing Activities:
This section details the cash flows associated with external financing activities. Sources of cash inflow would be cash raised by selling stock and bonds or by bank borrowings. Likewise, paying back a bank loan would show up as an outflow and so would dividend payments & common stock repurchases.
Example of cash flows from operating activities:

The above examples are discussed keeping in mind the normal business activities of a manufacturing firm.
However, for a bank the definitions would change a little. For example, in the case of a manufacturing firm, interest income is not its operating or core business income, hence it is a part of cash flow from financing activities. Nevertheless, for a bank, interest income is a part of its core business operations and hence it forms a part of cash flow from operations.
Master the art of understanding cash flow in the stock market with our 'Stock Market Made Easy' course. Enroll now!
A sample Cash flow statement of Company XYZ:

Stock Investment Ideas
Now that we have a complete understanding of financial statements. Let us learn a few simple steps to generate stock investing ideas.
What are the few simple ways to generate Stock Investment ideas?
This is one of the most searched topics in the investment world. Out of thousands of companies listed on the exchange, it becomes very difficult for anyone to conduct research and decide in which companies to invest. Knowing the basics of the stock market is the first step to being able to invest in the stock market.
Let’s make it simple for you-
a. You may start with Nifty 200 list of companies
b. Chuck out companies which are outside your circle of competence. Don’t worry if you chuck out a lot of companies in this process.
How to generate stock investment ideas?
1. Stock scans and screeners
Using proper screeners and scans can filter the stocks which suits your investment decision making process.
You can use the StockEdge App and create fundamental scans of your choice.
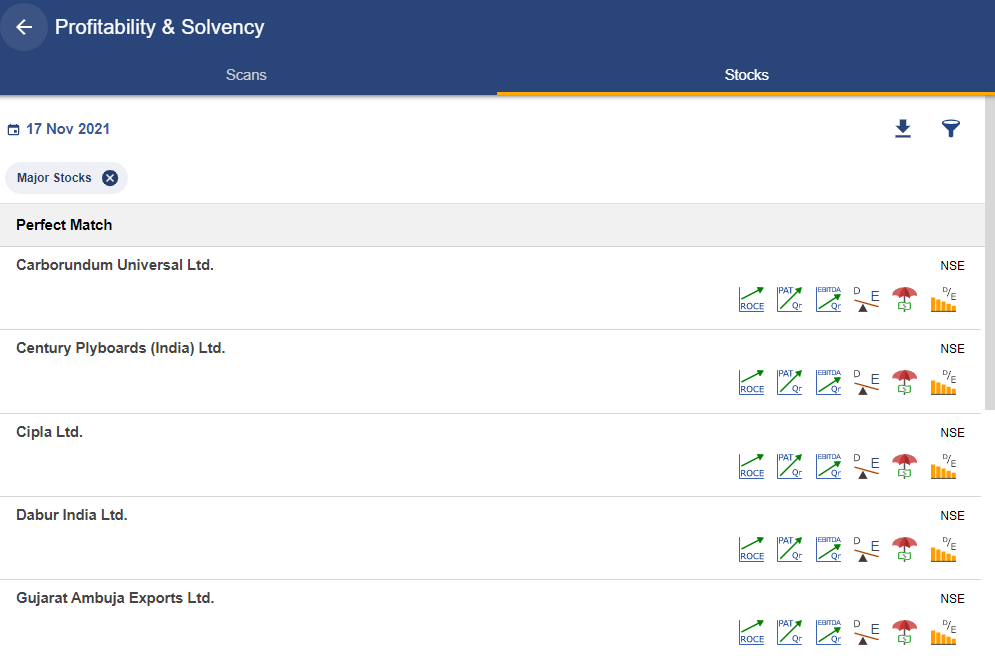
Suppose you want to screen stocks with improved profitability and solvency.
We have chosen six scan parameters, belonging to the above segment, to find companies having:
- Improved Return on Capital Employed
- Quarterly Net Profit Growth YoY
- Quarterly EBITDA Growth YoY
- Low Leverage
- High Interest Coverage Ratio
- Consistently Decreasing Leverage
This will provide you with the list of all stocks that conform to the set scan parameters of improving profitability along with strong financial risk profile, using which you can determine the best investment option.
You can follow a step-by-step instruction on how to create a fundamental scan by Clicking here.
2. Disgraced stocks (52-week low list)
Most people have a tendency to avoid disgraced stocks but the contrarian minds always look for beaten-down stocks to find value.
Never take cues from the stock price, rather look for strong businesses which have corrected much from its highs.
Before entering into such stocks always question whether fall in such stocks is permanent or temporary?
3. General Observations
Seek ideas from things you use in daily life or see around yourself.
Do research on the companies whose product or service you like the most.
It’s not that you need to be very intelligent to invest in the stock market, rather you should keep your eyes and ear open to find good business ideas from the things around you.
“Everyone has the brainpower to follow the stock market. If you made it through fifth-grade math, you can do it”
- Peter Lynch
4. Business Media
It is not at all a wise idea to invest your hard-earned money based on tips and stock ideas provided by media houses. In most cases, these tips are made to favour vested interests and you may end up losing a significant chunk of your capital.
5. Blogs
There is an ample number of articles and blogs available which you can take as a base to start your own research work. Instead of blindly believing in what the author believes in, conduct your own due diligence.
6. Read Annual Report of companies
Flipping through countless pages of corporate trivia may seem to be a mundane task at first. However, the potential of this method to find stock ideas can surprise you.
In the annual report, the company’s management discusses the important aspects of the company like industry performance, its vision for the long term, opportunities and threats faced by the company, the company’s historical performance etc.
Check out the annual report of Marico India here -
Performance at a glance:

Financial analysis of Marico India as per FY 20-21 annual report:
Key Pointers from the annual report:
Moat: The domestic business quickly bounced back in the following quarters to exceed pre-COVID levels as more than 90% of our portfolio comprises daily-use items under the aegis of strong market leader brands. We witnessed robust growth across each of our core portfolios of Coconut Oil, Saffola Edible Oils, Value Added Hair Oils, and Saffola Oats.
Performance: Despite covid lockdowns last year, Marico's revenue increased by 10% & delivered a 23% CAGR return on PAT since its inception.
Good initiative: During the ongoing pandemic, your Company has been able to distribute 1.4 Million masks, 6.7 Lakhs PPE kits, and 633 ventilators to help safeguard the lives of primary healthcare workers, the police, and emergency services staff, among others.
International presence: Marico's business is spread over more than 25 countries worldwide & has a market share of 23% in FMCG business globally.
Award & recognition: Ranked 6th among India's most Sustainable Companies with an A+ rating – BusinessWorld and Sustain Labs Paris.
6 simple ways to generate stock investment ideas:
Warren Buffett way
Now let us discuss a few points on how a market guru like Warren Buffett conducts his fundamental analysis.
Warren Buffett is seen as a role model by most investors in the world who want to emulate classical value investing. He does his stock picking on a rational basis and avoids any sort of fear and hype in the market to identify value stocks. In most cases, he is seen to take a contrarian approach since he is often selling when others are buying and vice versa.
To learn how to evaluate a stock, join the NSE Academy Certified Equity Research Analysis course on Elearnmarkets.
There’s a famous quote by Warren Buffett on contrarian approach-
“Be fearful when others are greedy and be greedy when others are fearful”
But how do you find value stocks? and how do you value a stock? The market value is quite obvious which is the current market price of a stock on any given day. But what about its intrinsic value or the real worth of the company.
Though finding out the intrinsic value is a real challenge but if you can master stock price valuation, you can really become rich. This is what most value investors look for while they do their stock picking. Simply by comparing the intrinsic value with its stock price, you may accordingly take a bullish or bearish decision as the case may be.
Click here to know how to calculate intrinsic value.
Here are some of the powerful tools using which Warren Buffett pick value stocks:
1. Return on Equity (ROE)
Warren Buffett often uses Return on Equity (ROE) as part of his investment decision making process. He cares about a company that uses his money wisely and efficiently. ROE doesn’t care about the stock price rather it suggests that the company is able to utilize its money wisely.
Return on Equity (ROE), which is net income/owner’s equity. This is defined as how efficiently a business is using its equity to generate profits or how much profit a company generates with the money shareholders has invested. Right from the start, it makes sense to use this as an important measure for a stock buying decision because it shows how much management values its company.
ROE also needs to be compared to businesses in the same industry to provide useful information to a potential investor. So, for example, ROE for Bank of Baroda should be compared to ROE of PNB. ROE is one measurement commonly used to decide if an investment is worth purchasing. But of course, it should not be the only one. As a matter of fact, it can be artificially increased as well if a company buys back shares of its stock or increases debt. This is a reason why some say ROE could be misleading if you just take it at face value.
2. Return on Asset (ROA)
Return on Assets (ROA) is a type of return on investment (ROI) that measures the profitability of a business in relation to its total assets. This ratio indicates how well a company is performing by comparing the profit it’s generating from the money invested in assets. The higher the return, the more productive and efficient management is in utilizing economic resources.
Though Buffett focuses on return on equity but as we have seen that it may be distorted by leverage or share buyback, hence it is theoretically inferior to some degree to Return on Asset. Warren Buffett also understands the same but instead examines leverage separately, preferring low-leverage companies. Moreover, he also looks for high-profit margins.
3. Return on Capital Employed (ROCE)
Return on capital employed or ROCE is a profitability ratio that measures how efficiently a company can generate profits from its capital employed by comparing net operating profit to capital employed. In other words, return on capital employed shows investors how many rupees in profits each rupee of capital employed generates.
ROCE is a long-term profitability ratio because it shows how effectively assets are performing while taking into consideration long-term financing. This is why ROCE is a more useful ratio than return on equity to evaluate the longevity of a company.
The return on capital employed (ROCE) is a better measurement tool than return on equity, because ROCE shows how well a company is using both its equity and debt to generate a return.
4. Debt to equity ratio
A company with a low debt-to-equity ratio is conservatively financed, another Buffett parameter in finding value stocks. This is another easy equation: Simply divide the company's total liabilities by stockholders' equity. Debt-to-equity ratios can vary by industry, but since we are playing it safe like Buffett, look for debt-to-equity ratios below one.
High ratios can mean a company has been financing its growth with debt, which is not usually a sustainable practice as it can lead to volatile or uncertain earnings, high interest rate charges or even bankruptcy.
Conclusion
Just as Warren Buffett has said multiple times, stock picking with “predictable and proven” earnings can be very profitable in stock market investing where investors are rewarded with consistent business growth. Moreover, permanent loss of capital can also be largely avoided in this method of stock picking.
Buying undervalued predictable companies is even better and this strategy can greatly outperform the market averages. Apart from the above discussed powerful tools, Buffett also focuses on circle of competence, presence of moats, investing in good management, keeping a long-term mindset, taking contrarian play during difficult times, etc.


