Introduction
What is a commodity?
A commodity is a good, merchandise, or, a raw material which has a value, and, at the same time, can be used for commercial purposes. Rice, wheat, pulses, etc. are some of the common types of commodities, whereas gold, silver, etc. are considered to be important investment – grade commodities. Commodity prices are driven by both, the supply of both, local and global markets, and demand scenarios. Local Markets where commodities are purchased and sold are called Mandis, whereas, local intermediaries through which they are sold are called Arthiyas Mandi Fees. Commodity markets were developed much before equity or bond markets.
Need for commodity markets arises because every country has its own demographics, and any investment decision in a country is taken after evaluating the factors that affect the GDP of that country. For example, Saudi Arabia is an oil-producing country, and any change in prices of oil can change the flow of investments in Saudi Arabia. There are various companies who have an indirect exposure into the commodity business, for example, ONGC, etc.
A major cost of any company is the cost of raw materials it purchases; raw materials are most of the times a kind of commodity. This means that any company which wants to reduce these costs, should have good knowledge about the commodities that they deal in so that the future price movements can be made about that commodity.
One more reason is that commodity stocks represent almost 15% of the Nifty Index. A market reacts when there is any major news about a commodity. This means that an investor who has purchased a fund which represents NIFTY for example, should have an idea about commodities to correctly predict the price movements.
Various fund managers consider commodities as an important investment vehicle because commodities move in opposite directions when compared to the equity markets.
Commodity markets are considered to be more volatile than the equity markets, and more specialisation is required for these markets. Due to their extreme nature, anyone who wants to generate profits from these markets should be skilled and have expert knowledge.
It is seen that picking a skilled manager is considered important when selecting a fund which deals in commodities because the difference between the returns of a top-quartile fund, and a bottom quartile fund are significant. Major differences in a fund’s returns are not that significant in equity markets.
Having an exposure into a commodity can provide an investor with diversification benefits. Next, we will learn the different classifications of commodities that will help you to make a diversified portfolio.
Classifications Of Commodities
Commodities are commonly classified into four types:
Bullions:
The word bullion is used for a precious commodity like gold, silver, etc. This is because a precious metal like gold has a very high retention value. A bullion’s value does not diminish quickly.
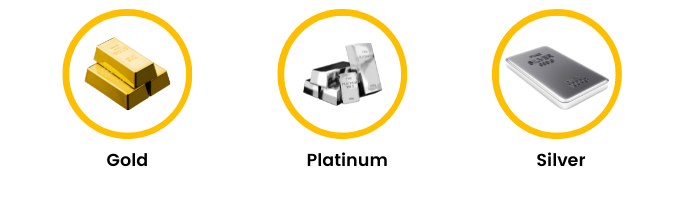
1.Gold – Gold is one of the oldest precious metals which is known to humans. Gold is used as a commodity, a currency, and also as an investment vehicle. It is also the most popular bullion commodity that trades in the markets. Gold is also used as a form of jewellery. Recently, paper gold has emerged as a good investment vehicle. A major reason is that unlike physical gold, paper gold has less selling costs and no storage costs, hence providing better returns.
2.Platinum – Platinum is a very important precious metal and has multiple uses. Just to name a few, platinum can be used as jewellery, it can be used in electronics, and also in automobiles. There are platinum futures contracts which trade in many exchanges, one of the major exchanges where platinum trades is the Tokyo Commodity Exchange (TCE).
3.Silver – Silver can be used in industries like photography, fashion, and electrical industry to name a few. Gold and silver generally move in the same directions. The main source of silver is lead ore.
Base Metals:
A metal is classified as a base metal if it is not considered a precious metal like gold or silver:
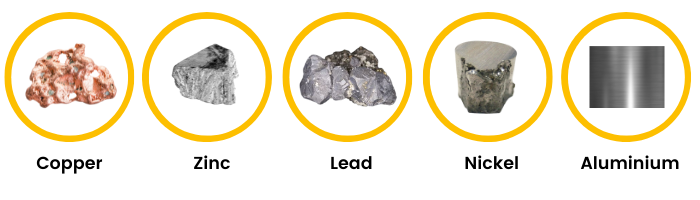
1.Copper– Copper (chemical symbol - Cu) is a malleable and ductile metallic element which is an excellent conductor of heat and electricity. It ranks 3rd in world consumption basket for metals, coming after steel and aluminium. Copper is a highly traded commodity.
2.Zinc- Zinc (chemical symbol- Zn) is a bluish-white lustrous metal, and is normally covered with a white coating. It is the 4th most common metal in use. Zinc can be recycled indefinitely.
3.Lead– Lead is one of the most sustainable and recyclable commodities available in the market. Lead is an important component in the production of batteries.
4.Nickel- Nickel is used in various industries such as engineering, electrical, infrastructure, automobile, packaging, etc. Nickel is a very volatile commodity because of its high demand and low supply.
5.Aluminium– Aluminium is a chemical element, and is the most widely used non – ferrous metal. Theoretically, it is possible to recycle aluminium indefinitely without compromising any of its qualities.
Energy:
1.Crude Oil - Crude oil is a mixture of hydrocarbons that exists in a liquid phase in natural underground reservoirs. Almost all industries are dependent on oil in one way or another. Oil & lubricants, agriculture, transportation, petrochemicals, paints, etc. are largely and directly affected by movement in oil prices. Prices of crude oil are known to be highly volatile.
2.Natural gas – Natural gas is a form of fossil energy and is formed deep beneath the Earth’s surface.
Other forms of energy commodities include Heating Oil, Gasoline, Electricity, etc.
Argo Commodities:
There are several types of agro commodities that traded in a commodity market:
1.Plantation: Rubber.
2.Cereal: Barley, Wheat and Maize.
3.Pulses: Chana.
4.Spices: Cardamom, Coriander, Turmeric Oil & Oil.
5.Seeds: Crude Palm Oil, Soya Bean, KapasiaKhalli, Refined Soya Oil.
6.Others: Kapas, Cotton, Gaur, Potato, Sugar.
So, you know how commodities are classified in India. As they are traded over recongnised exchanges: these commodities are highly regulated. But who are they? Let’s find out:
Regulatory Framework of Commodities markets in India:
1.Forward Contract (Regulation) Act, 1952:
All types of forward contract in commodities are governed by the Forward Contract (Regulation) Act, 1952. After a merger with SEBI, the commodity derivatives are governed by Securities Contracts (Regulation) Act, 1956.
2.Forward Market Commission:
The Forward Markets Commission (FMC) was the chief regulator of commodity futures markets in India.
A separate division: Commodity Derivatives Market Regulation Department (CDMRD) has been formed in SEBI to manage the functioning of commodity derivatives in India.
3.About SEBI:
The Preamble of the Securities and Exchange Board of India (SEBI) describes the basic functions as, "to protect the interests of investors in securities and to promote the development of, and to regulate the securities market and for matters connected therewith or incidental thereto”.
After learning the different classifications of commodities & their regulatory framework next, let us understand the various factors that affect the price of a commodity.
Macro Factors Affecting The Price Of A Commodity
Unlike Equity or Debt markets, Commodity markets are very different and are affected by various demand and supply factors.
Demand Factors:
1.Own price of the commodity – The price of a commodity is inversely related to its demand. As price rises, only the richer class of society can afford that product, leading to a decrease in demand for that product, and vice-versa.

2.Price of Related Commodity – Related commodities are of two types: -

3.The income of Consumers – Demand generally increases when a consumer’s income or expectation of their future income increases, and vice –versa.

Supply Factors:
1.Price of Commodity – The price of a commodity is positively related to its supply, i.e., when supply goes up, prices of that commodity rises, and vice – versa.
2.Technology Used - Technological changes can influence the supply of a commodity. Using advanced technologies can increase the supply of that commodity, and vice-versa. Using better technologies can also reduce the cost of production of that product.
3.Cost of Production –The lower is the cost of production of a product, the more profit a producer enjoys. Higher are the profits, more is the supply and vice- versa.
4.Weather and Seasonality – Bad weather situations in a country can lead to a decrease in the supply of that commodity. It is seen that supply of a commodity is high during a season, for example, a mango is in high supply from the month of May to September, and less supply during the rest of the year.

The following image depicts the supply of a commodity. As we can see the supply of mango is low in the month of January and as September approaches, the supply of mangoes reaches its peak. This cycle repeats every year.
5.Government Policies – Unfavourable policies of a government can have adverse effects on the supply of a commodity, whereas, favourable situations can lead to an increase in the supply of a commodity.
Types Of Commodity Markets
Commodity markets are physical or virtual marketplaces which are used for buying and selling commodities. So, let us discuss each of them respectively.
Physical Market:
Physical Markets are markets where commodities are purchased and sold in physical forms. When we hold a commodity in its physical form, it is generally perishable and needs to be stored in a proper place. Spot trades are delivered in a physical market in T+11 days. Forward contracts with future settlements are regulated through State Agriculture Marketing Boards, operated under the APMC Act of various states.
There are restrictions on farmers to contact directly with processors/manufacturing/bulk purchasers. Multiple states have amended their acts and promoted: Direct marketing, Contract farming, Private markets, Cooperatives, etc.
There are two types of trades take place in a physical market:
1.Price based trading
2.Auction based trading
But there are a few problems with a physical market:
1.Lack of proper price dissemination and transparency.
2.Lack of proper certifications and standardizations.
3.High intermediary costs involved, which leads to distress sale by farmers.
4.High dependency on unorganized money lenders by farmers.
Now, let us understand what Virtual Commodity Markets are:
Electronic Spot Exchanges:
Electronic Exchanges are considered to be better than physical markets. Trades in electronic exchanges are not Over –The – Counter (OTC), instead trades are placed online,where an exchange acts as an intermediary. Trades in spot markets are executed on spot prices, i.e., price as of now.
Spot exchanges reflect prices on a real-time basis based on demand and supply, and trades are done in paper/dematerialized (Demat) form.
Few advantages of the Spot exchanges are:
1.Transparency in prices.
2.Reduces intermediary costs.
3.Facilitates clearing and settlement, by acting as a clearinghouse.
4.Takes margin deposits and eliminates credit risks.
Derivative Markets:
A derivative is a financial instrument which derives its value from an underlying asset like a commodity, equity, foreign exchange, etc.
Commodity derivative markets are exactly like equity derivatives markets with a few minor differences.
The underlying in a commodity derivative market is a commodity, unlike equity markets.
Since commodities are perishable in nature, the cost of storing a commodity becomes vital when calculating the price of a derivative.
Commodity derivatives are contracts that allow an investor to profit from certain commodities without possessing them. The buyer of a derivative contract buys the right to buy/sell a commodity at a specific price on a specified future date.
We will discuss more on the Commodity exchanges, derivatives, options and swaps in the upcoming units of our module.
Commodity Exchanges
A commodities futures exchange is an exchange where derivative contracts of various commodities are traded through a single mechanism (central order routing), by facilitating effective price discovery.
Commodity exchanges have the following functions:
1.They serve as an intermediary between buyers and sellers.
2.They take margins in the form of deposits on transactions to eliminate credit risk from the markets.
3.Exchanges Set up all the rules and regulations to minimize fraudulent activities in the market.
4.Establishing worldwide standard prices for all the commodities traded.
There are two major commodity exchanges in India, which are:
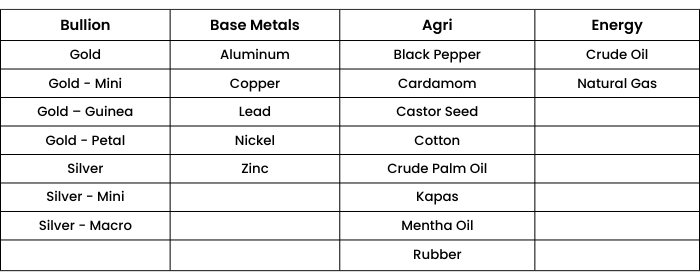
1. Multi Commodity Exchange (MCX):
Multi Commodity Exchange of India Ltd (MCX), is an electronic commodity futures exchange which started its operations in November 2003. It offers more than 40 commodities across various segments such as bullion, ferrous and non-ferrous metals, energy, and several Agri-commodities on its platform. MCX holds a market share of 96.48% in terms of the value of commodity futures contracts traded, as of Dec 2020.
List of commodities that are traded on MCX:
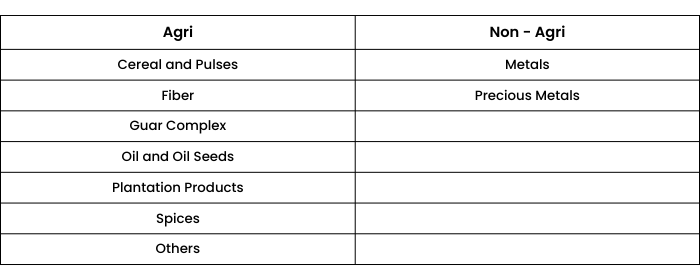
2. National Commodity and Derivative Exchange (NCDEX):
National Commodity and Derivative Exchanges or NCDEX, is one of the leading commodity exchanges in India for agri-commodities. In the fiscal year of 2019, NCDEX had a market share of 81.5% in its agricultural commodity segment.
NCDEX began its business on the 9th of May, 2003.
NCDEX supports an order driven market and provides complete transparency of trading operations. The trade timings of the NCDEX are 9.00 a.m. to 5.00 p.m.
NCDEX offers two types of products:
- Agricultural products
- Non-agricultural products
List of commodities that are traded on NCDEX:
Some Global Commodity Exchanges are:
1. London Metal Exchange:
The London Metal Exchange (LME) is a futures exchange with the world's largest market share in options and futures contracts on base and other metals. The LME offers contracts with daily expiry dates of up to 3 months from the day they are traded, weekly contracts of up to six months, and monthly contracts of up to 123 months. LME also permits cash trading.
The LME offers futures and options contracts for Aluminium, Aluminium alloy, NASAAC (North American Special Aluminium Alloy), cobalt, copper, lead, molybdenum, nickel, steel billet, tin and zinc.
2. Intercontinental Exchange:
Intercontinental Exchange is an American network of exchanges and clearinghouses for financial and commodity markets. The ICE also owns and operates 5 central clearinghouses, that are:
- ICE Clear Europe
- ICE Clear U.S
- ICE Clear Canada
- ICE Clear Credit
- The Clearing Corporation
Price transparency, high efficiency, high liquidity and low costs are some of the features of this exchange.
3. Chicago Mercantile Exchange (CME):
The Chicago Mercantile Exchange is an American financial and commodity derivative exchange based in Chicago. CME, CBOT, NYMEX and COMEX are owned by the CME Group.
Similar to the Intercontinental Exchange, the contracts traded on CME are majorly future contracts and option contracts.
Strengths:
- It leads in size and scale.
- Highly liquid.
- Efficient trades.
- Most diverse product lines.
- Superior trading technology.
- Financial safeguard.
- Transparent and anonymous marketplace.
4. Tokyo Commodity Exchange (TOCOM):
Tokyo Commodity Exchange, Inc. (TOCOM) is an exchange located in Japan and is Japan’s largest, and one of Asia’s most prominent commodity futures exchanges.
TOCOM is an electronic exchange, which primarily trades for precious metals, oil, rubber and soft commodities. It also offers futures and options contracts for precious metals like gold, silver, platinum, palladium, etc., and, various energy contracts like crude oil, gasoline, kerosene and gas oil, etc. and, natural rubber and agricultural products like soybeans, corn and azuki.
Other Leading Commodity Exchanges of the World:

Commodity Derivatives
Global Commodity Derivatives:
In the last 5 years, it seems that derivatives trading has taken a major surge. This is a positive sign and signals positive investor sentiment in the markets. This is a positive sign for an economy as well.

Source: www.fia.org
Commodity Derivatives Vs. Financial Derivatives:
The basic concepts of derivatives remain the same irrespective of them being on a financial asset or a commodity.

Commodity Options
As we have already discussed commodity futures previously, let us now start with commodity options. It is very similar to any other option contracts like that of stock options or index options. It offers a choice of whether to exercise the contract or not at expiry.
Commodity options are available on both the MCX and NCDEX exchanges.
Here is the option contract of Gold on MCX:

Here is the call option contract of Soybean on NCDEX:


Commodity Swaps
A swap is an agreement between two parties to exchange two different cash flows, i.e., exchange of a variable cash flow for a fixed cash flow or vice – versa. Swaps are typically OTC traded.
To understand commodity swaps, let us take an example:
Suppose there is an airline company which is worried about the fluctuation in the prices of one of its commodities, i.e., oil. The company is expecting that the prices of oil will go up. The airline company goes to an investment bank and agrees to pay a series of fixed payments and in turn, will receive variable payments. These payments will be based on the current prices of oil which can be then paid to the oil manufacturer. This is an effective way to hedge future price uncertainty of a commodity.
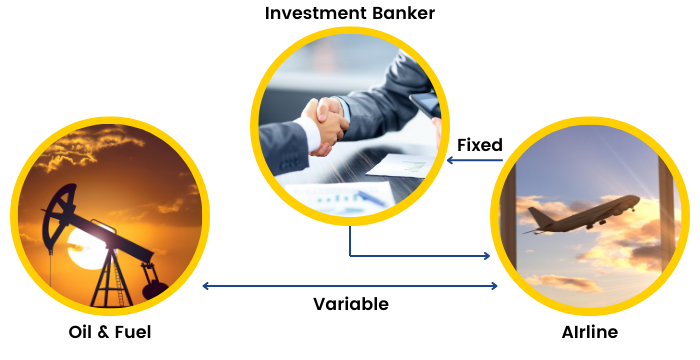
Commodity Swaps are generally OTC traded and are complex instruments. Only large institutions and investment bankers generally enter into a swap, because the value of these contracts are really high.
Trading Strategies Using Commodities
A huge trading opportunity lies in the world of commodities. Let us discuss some trading strategies using commodities as the asset class.
Arbitrage Strategies:
Arbitrage means buying and selling the same underlying in 2 different markets. This strategy guarantees a risk-free profit.
For example, Gold is selling for ₹48500 at MCX and Gold Mini is trading at ₹48505 at MCX. I can buy Gold for ₹48500 and sell Gold Mini at ₹48505 on MCX, locking in a cash flow of ₹5 without taking any risk.
Arbitrage opportunity generally exists in markets where trading occurs infrequently, or there are no transaction costs.
A market which is highly liquid and transparent, and where there are significant transaction costs, commissions, etc. will see little to no arbitrage opportunities.
Spread Strategies:
A spread strategy is created when a trader tries to profit from the difference between the bid and ask spread. of an underlying.
An example would be to trade between the contracts of different sizes, Gold Main and Gold Mini at different sizes.
In a spread strategy, the underlying is the same, but the instruments through which the underlying is purchased or sold are different.
The price movement of the underlying is not relevant in this strategy. Instead, the movement in the spread of that underlying is way more important.
There is a risk of a spread expanding or contracting involved with this strategy.
Calendar Spread:
Calendar Spread is a form of spread strategy.
A calendar spread involves buying and selling a futures contract of an underlying at the same strike price but at different expiration dates. The goal here is to profit from the mispricing between 2 contracts of different periods.
For example,
Buy a Gold futures contract at ₹16000 on 27th Jan 2021.
Selling a Gold futures contract at ₹16200 on 27th Feb 2021.
Here the contracts are traded on the same day, but the expiries of the 2 contracts are assumed to be different. The risk involving a calendar spread strategy is quite low, hence the profit generated from this strategy is generally not very significant.
Spread moves because of movement in the price of underlying which affects the price of a contract.

Higher the difference, higher are the chances of generating profits by using this strategy.
From the above image we can see that the difference in OI traded between Nov and Dec starts to get big from 11/21/2020, indicating that this strategy can now be used.
Jobbing/Scalping Strategy:
This is an extremely short-term trading strategy where the target is to earn 1-2 ticks over and above the transaction cost with a stop of 1-2 ticks.
This strategy involves extremely high-frequency trading.
Price movements are predicted by:
- Analysing the market depth by evaluating the buyers and sellers and their respective appetites.
- The idea is to trade by evaluating the behaviour of existing buyers and sellers in the market.
The most important parameter for jobbing are transaction costs. Jobbing is impossible when transaction costs are high.
Also, high transaction cost reduces the depth of a market, and makes the participants move out. This makes the model risky.
Example of cost of trading in Crude Oil:
- The total cost of trading ₹750 per crore.
- Value of one lot of Crude – ₹550000.
- Thus, total value to be traded – ₹550000*2 i.e., 1100000.
- Cost of Trading – 750*1100000/10000000 i.e.,₹82.5.
- Each tick movement of crude would give ₹100.
- Thus, net saving realised in one tick – 100-82.5 i.e.,₹17.5.
- Typically, one should realise at least 2 times of cost per tick, else, every trade will reduce the chances of making profits. For example, for every bad trade, profits will be reduced by 100+82.5 = ₹182.5. This means to recover your losses, you have to make 11 more profitable trades, which is unlikely.
Technical Based Trading:
This strategy involves trading using various technical analysis tools.
Depending on the trading duration, selection of the chart duration which will be used for making decisions is required.
One can use classical methods and trade more discretionarily, or one can use the modern method and trade using a trading model.
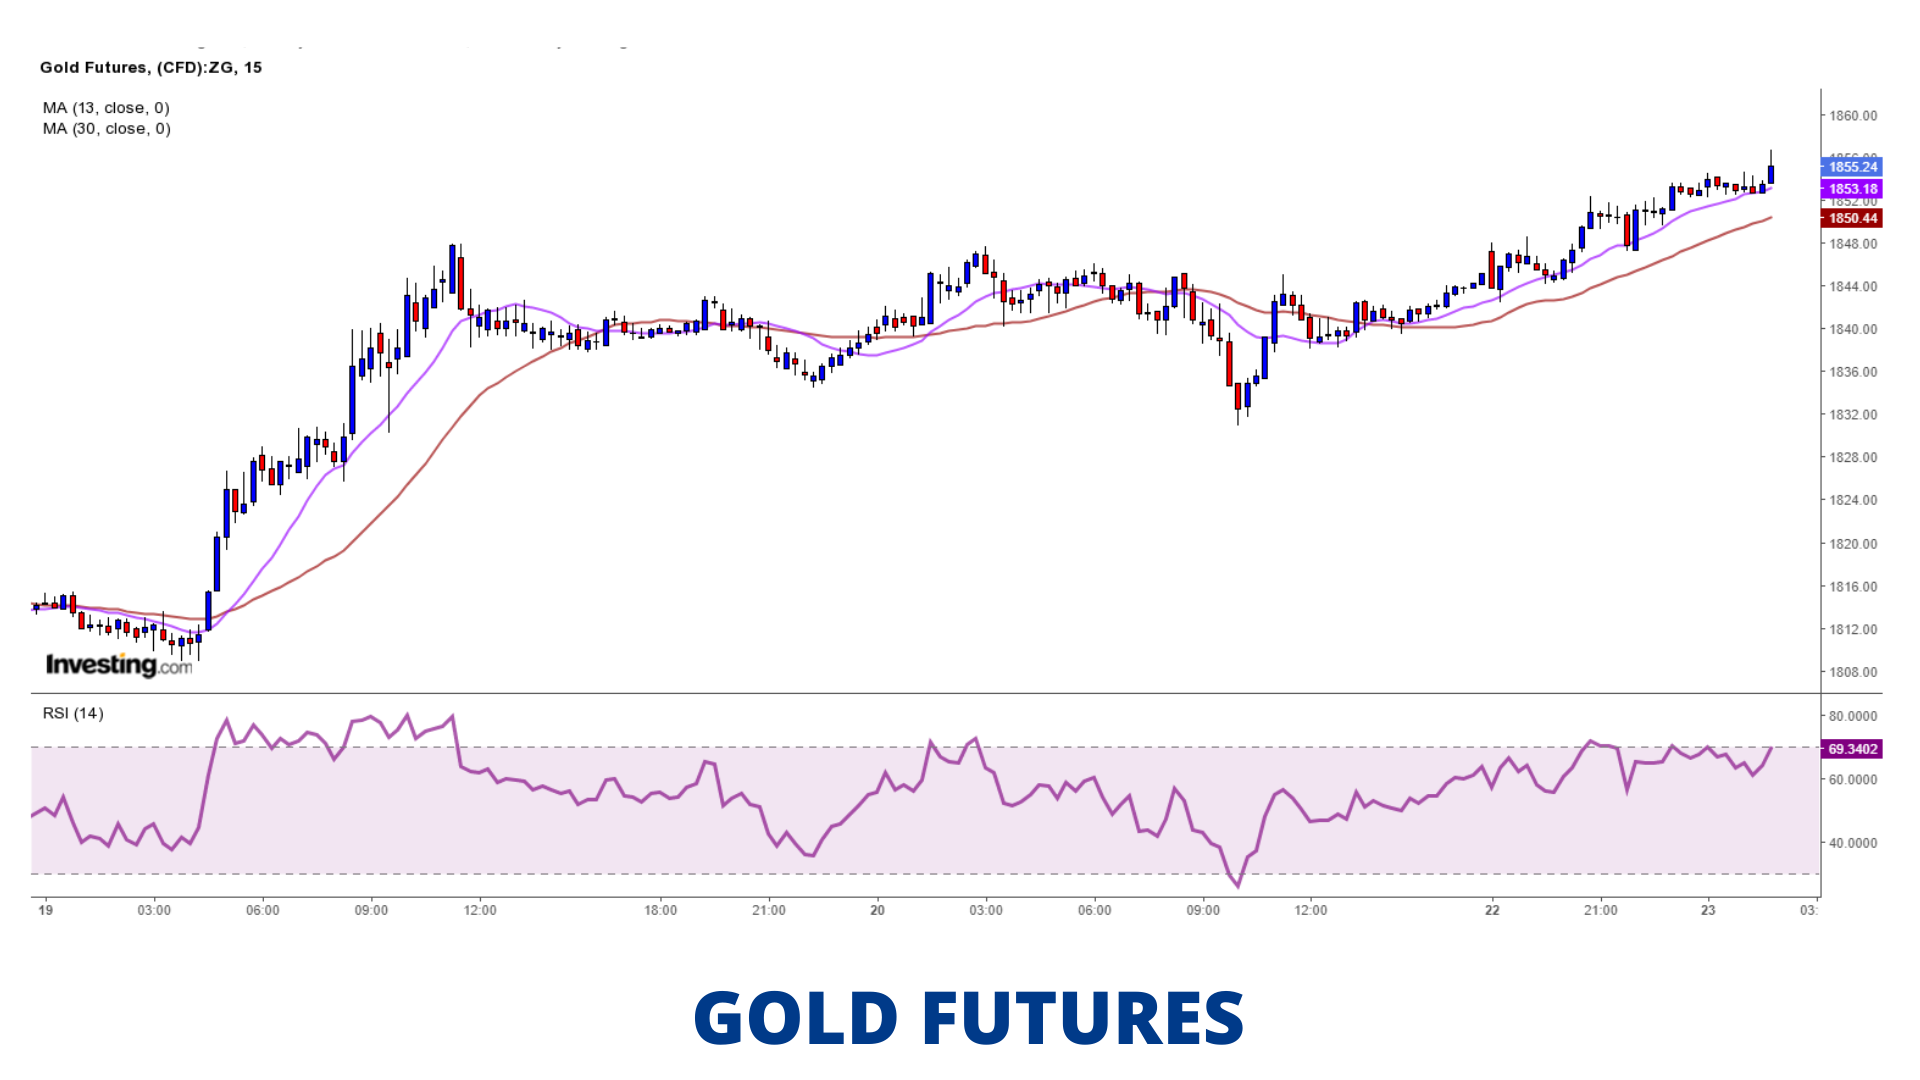
The above image is of a chart. A trader can look at various charts and make profits by correctly predicting the price movements of a stock.
Pair Trading:
This strategy involves taking opposite positions in two commodities, that is, a long (bullish) position in one commodity and another short (bearish) position in another commodity.
The objective here is to make money on the relative price movements of the 2 underlying.
The risk here is that the prices of two stocks might go up at the same time or vice-versa. Or, the two stocks might both go down, but the stock you are short can drop more than the stock you are long on or vice-versa. One half of the pairs trade may be profitable, and the other half of the pairs trade may lose money, but the goal should be that the profits should exceed the losses.
To identify a pair, there should be:
- Similarity in fundamentals.
- Deviation from mean prices.
Some classic pairs:
- Gold and Silver
- Silver and Copper
- Gold and Crude Oil
- Lead and Zinc
- Soya Bean and Soya Oil
Example: Gold and Silver
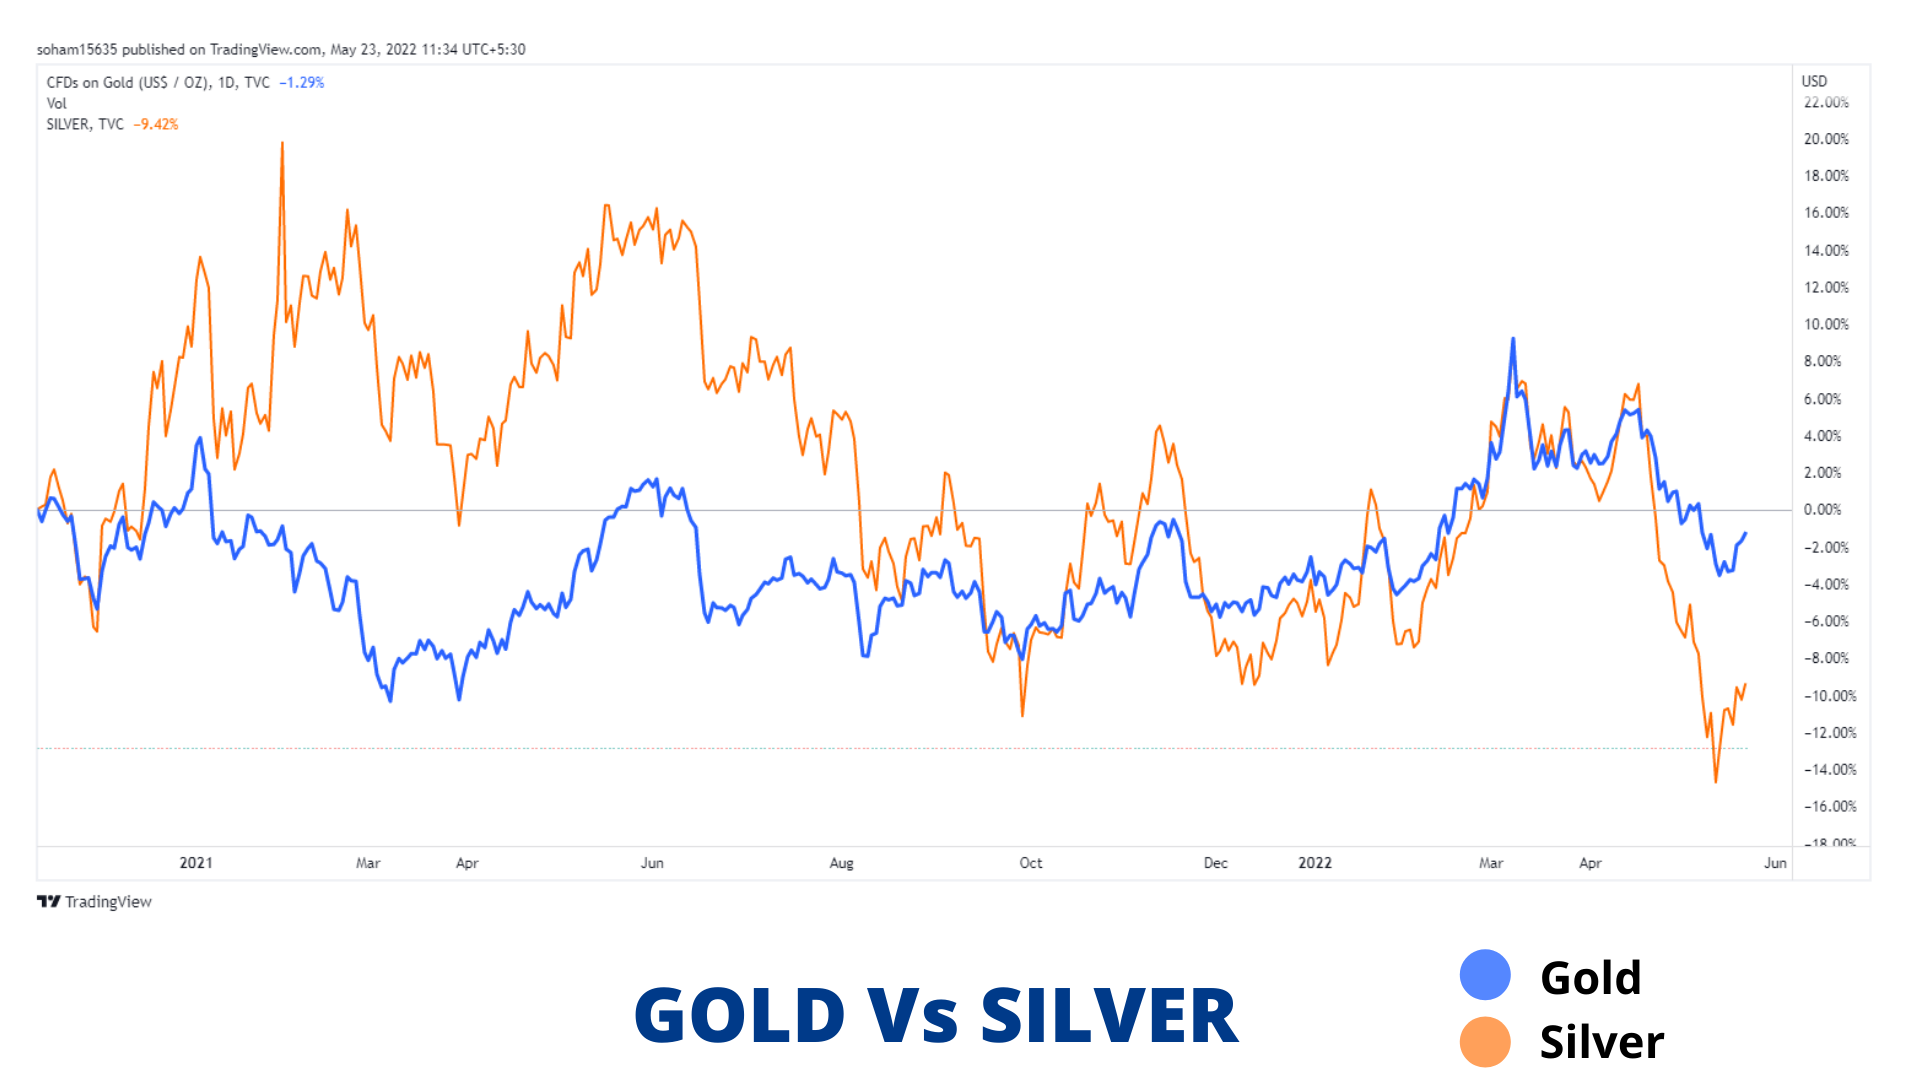
This graph shows the similarity in movement in gold and silver prices with minor fluctuations.
Gold
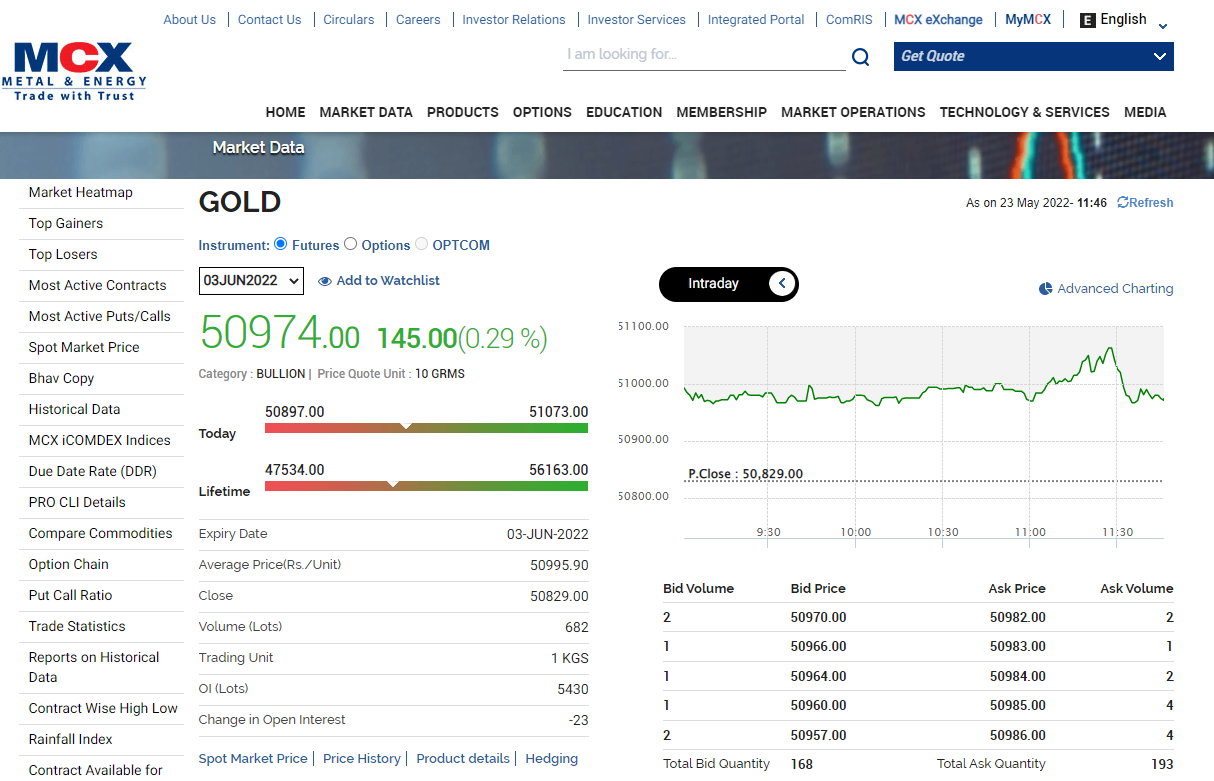
Now that we know how to use different commodity trading strategies, let us discuss a few popular commodities that are classified as Bullions and are popularly traded on the commodity exchanges—starting off with Gold which is one of the oldest precious metals known to humans.
Gold is used as a commodity, a currency, and also as an investment vehicle. It is also the most popular bullion commodity that trades in the markets.
The above price mentioned is the last traded price for 10 grams of gold. Since the lot size is 1 kg, the contract value is –
1000* 50,974 =₹50,974,000.
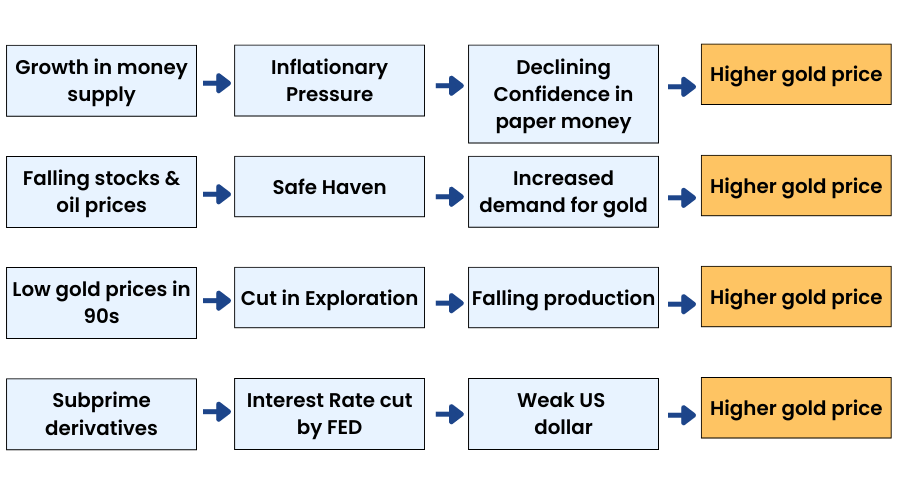
Factors Affecting Gold:
1.Demand supply mismatch.
2.Inflation – Positive correlation with gold prices
3.Interest rates – Negative correlation with gold prices.
4.Currency – US Dollar and gold have a negative correlation.
5.Crude Oil Prices – Positive correlation with gold prices.
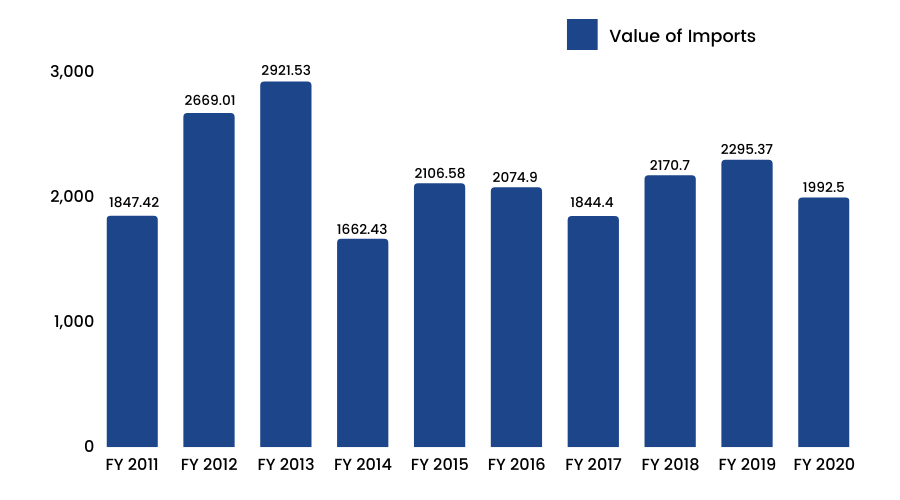
6.Value of gold imported into India from 2011 -2020.
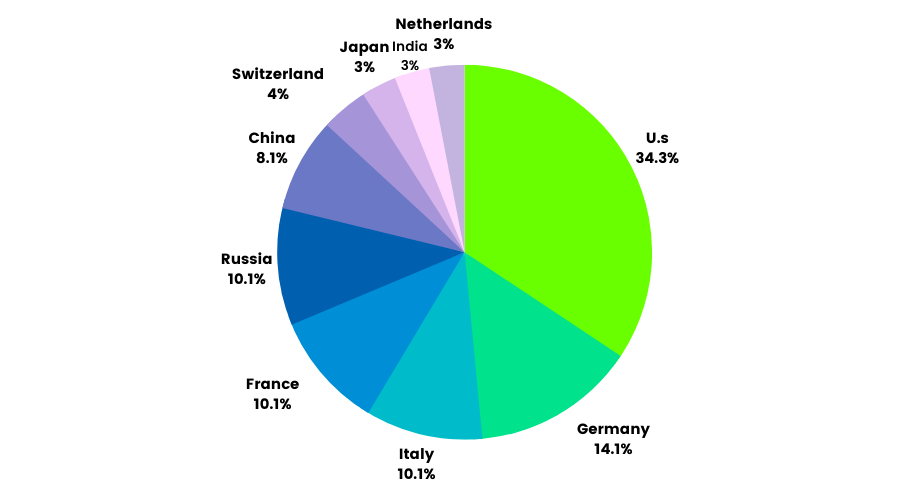
7.Global Gold Reserves:
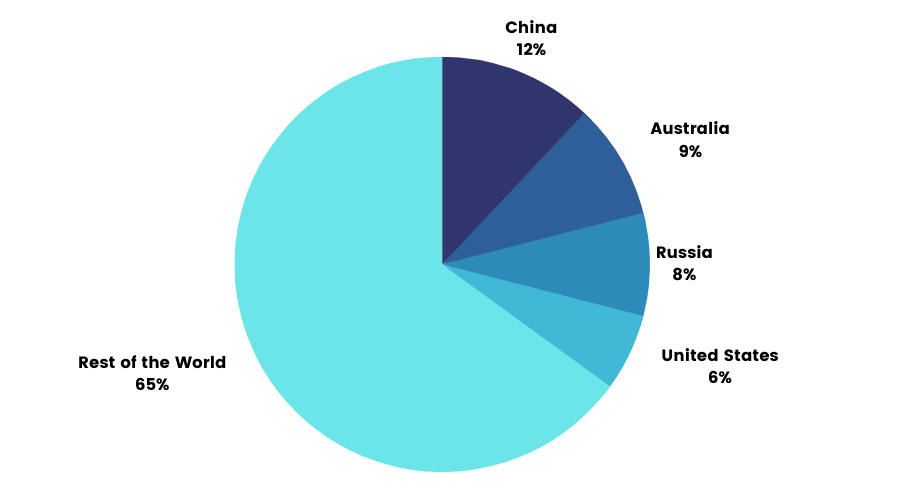
Top producers of Gold:
Other factors affecting gold prices are:
- In the U.S., gold futures are primarily traded on the New York Commodities Exchange and Euronext Life
- In India, gold futures are traded on the National Commodity and Derivatives Exchange and Multi Commodity Exchange
- The product symbol for gold futures is GC, and it is traded in a standard contract size of100 troy ounces
- The settlement of gold contracts is through delivery.
- The minimum fluctuation allowed in price is $0.10 per troy ounce, and it is held to a minimum of 995 fineness quality specification.
- Unit in which Comex Gold is quoted: USD / troy ounce.
- Conversion factor: 1 gram = 0.0322 troy ounce.
- Conversion Calculation: Comex Gold price * 0.0322 * INR Currency.
- Example: Comex Gold future stands at 926.40 and INR Currency is at 49.5950, the price of 1 gram = ₹926.4 * 0.0322 * 49.5950
= ₹1477.16 / gram
= ₹14771.60 / 10 gram
Gold is a commodity which is very actively traded on the MCX. Gold is very liquid, with an average daily volume of 1276 lots in the MCX.
Gold comes in 3 different variants:
1.Gold Guinea:
- Symbol: GOLDGUINEA
- Trading unit: 8 grams
- Maximum order size: 10 kg
- Tick Size: Re.1 per 8 grams
2.Gold Mini:
- Symbol: GOLDM
- Trading unit: 100 grams
- Maximum order size: 10 kg
- Tick Size: Re.1 per 10 grams
3.Gold Petal:
- Symbol: GOLDPETAL
- Trading unit: 1 gram
- Maximum order size: 10 kg
- Tick Size: Re.1 per 1 gram
All the gold contracts mentioned above trade on MCX.
The timing of the exchange is Monday to Friday: 09:00 A.M. to 11:30 P.M.
All kinds of gold contacts which are offered differ in terms of price, liquidity, lot size, etc.
The primary gold is the best contract to trade-in, but the margin required for executing that contract is the highest.
Silver
The next precious metal after Gold which we will discuss here, is Silver.
Silver (Chemical Symbol-Ag) is a brilliant grey-white metal that is soft and malleable. The main source of silver is lead ore. The sources of silver include coin melt, scrap recovery, and dis-hoarding from countries where export is restricted.
Silver is unique amongst metals because it can be classified as both a precious metal and an industrial metal. Nearly 60% of India's silver demand comes from farmers and rural India. Today, silver is sought as a valuable and practical industrial commodity and as an investment.
Silver is an important element of global monetary reserves, and is considered to be an effective portfolio diversifier.
Factors Affecting Silver:
1.Economic events such as national industrial growth, global financial crisis, recession, and inflation all affect silver prices.
2.Commodity-specific events such as the construction of a new production facility, unexpected mine or plant closures, or industry restructuring, also affect silver prices.
3.Government-set trade policy (implementation or suspension of taxes, penalties, and quotas), affect the supply of silver prices.
4.Geopolitical events involving governments or economic paradigms and armed conflict can cause major changes to the prices and supply of silver.
5.Faster growth in demand against supply often leads to a drop in stocks with the government and investors.
6.Silver demand is underpinned by the demand from jewelry and silverware, industrial applications, and overall industrial growth.
7.In India, the real industrial demand occupies a small share in the total industrial demand for silver. This is sharp in contrast to most developed economies.
8.In India, silver demand is also determined to a large extent by its price level and volatility.
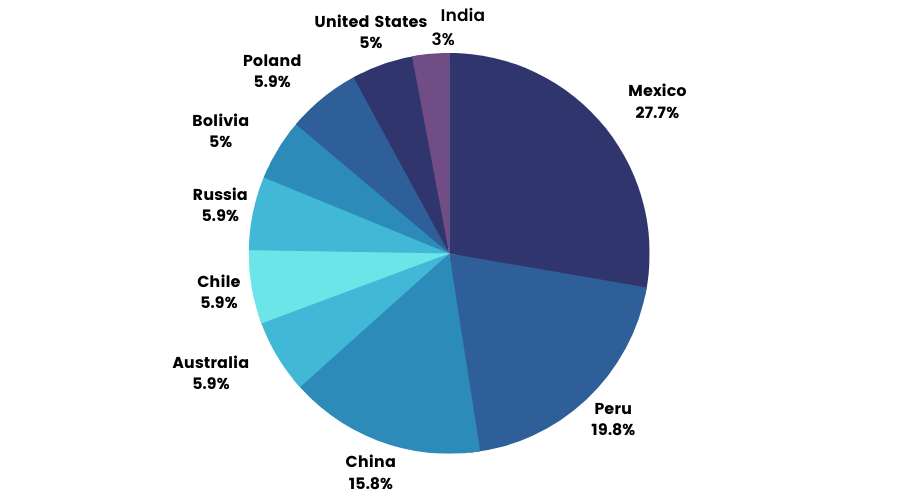
Top Producers of Silver:
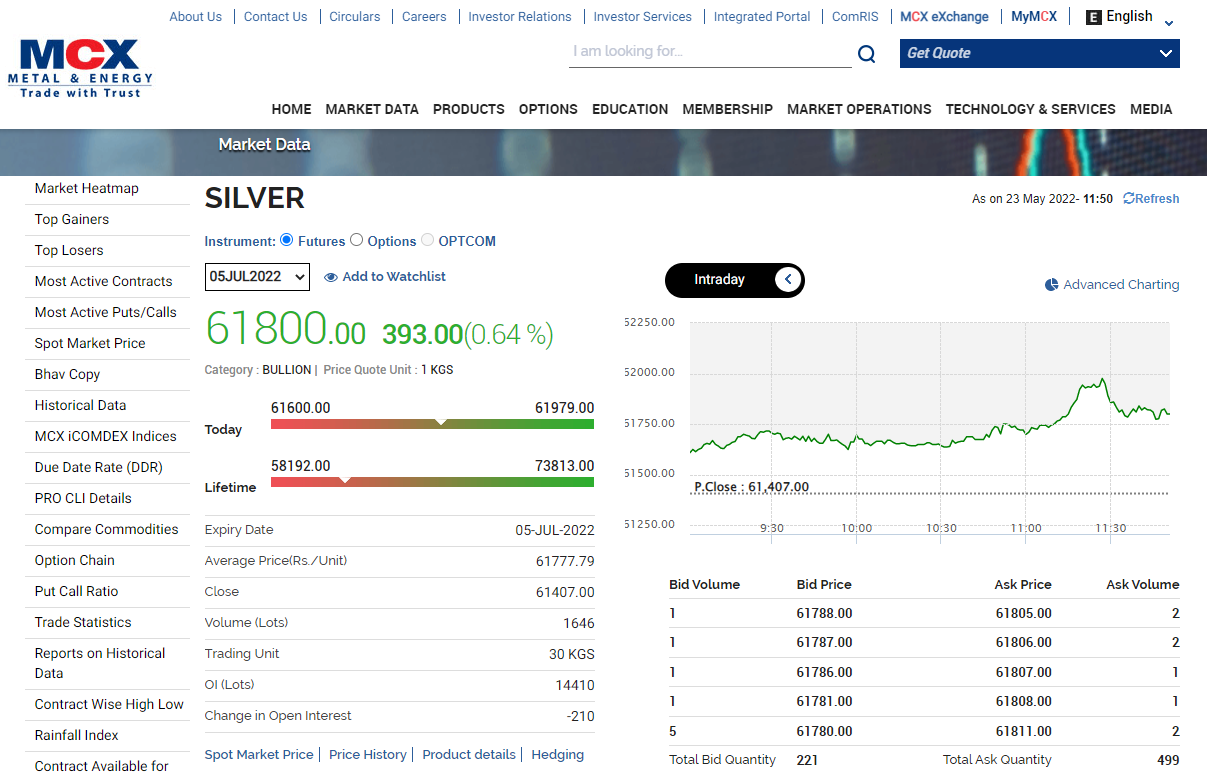
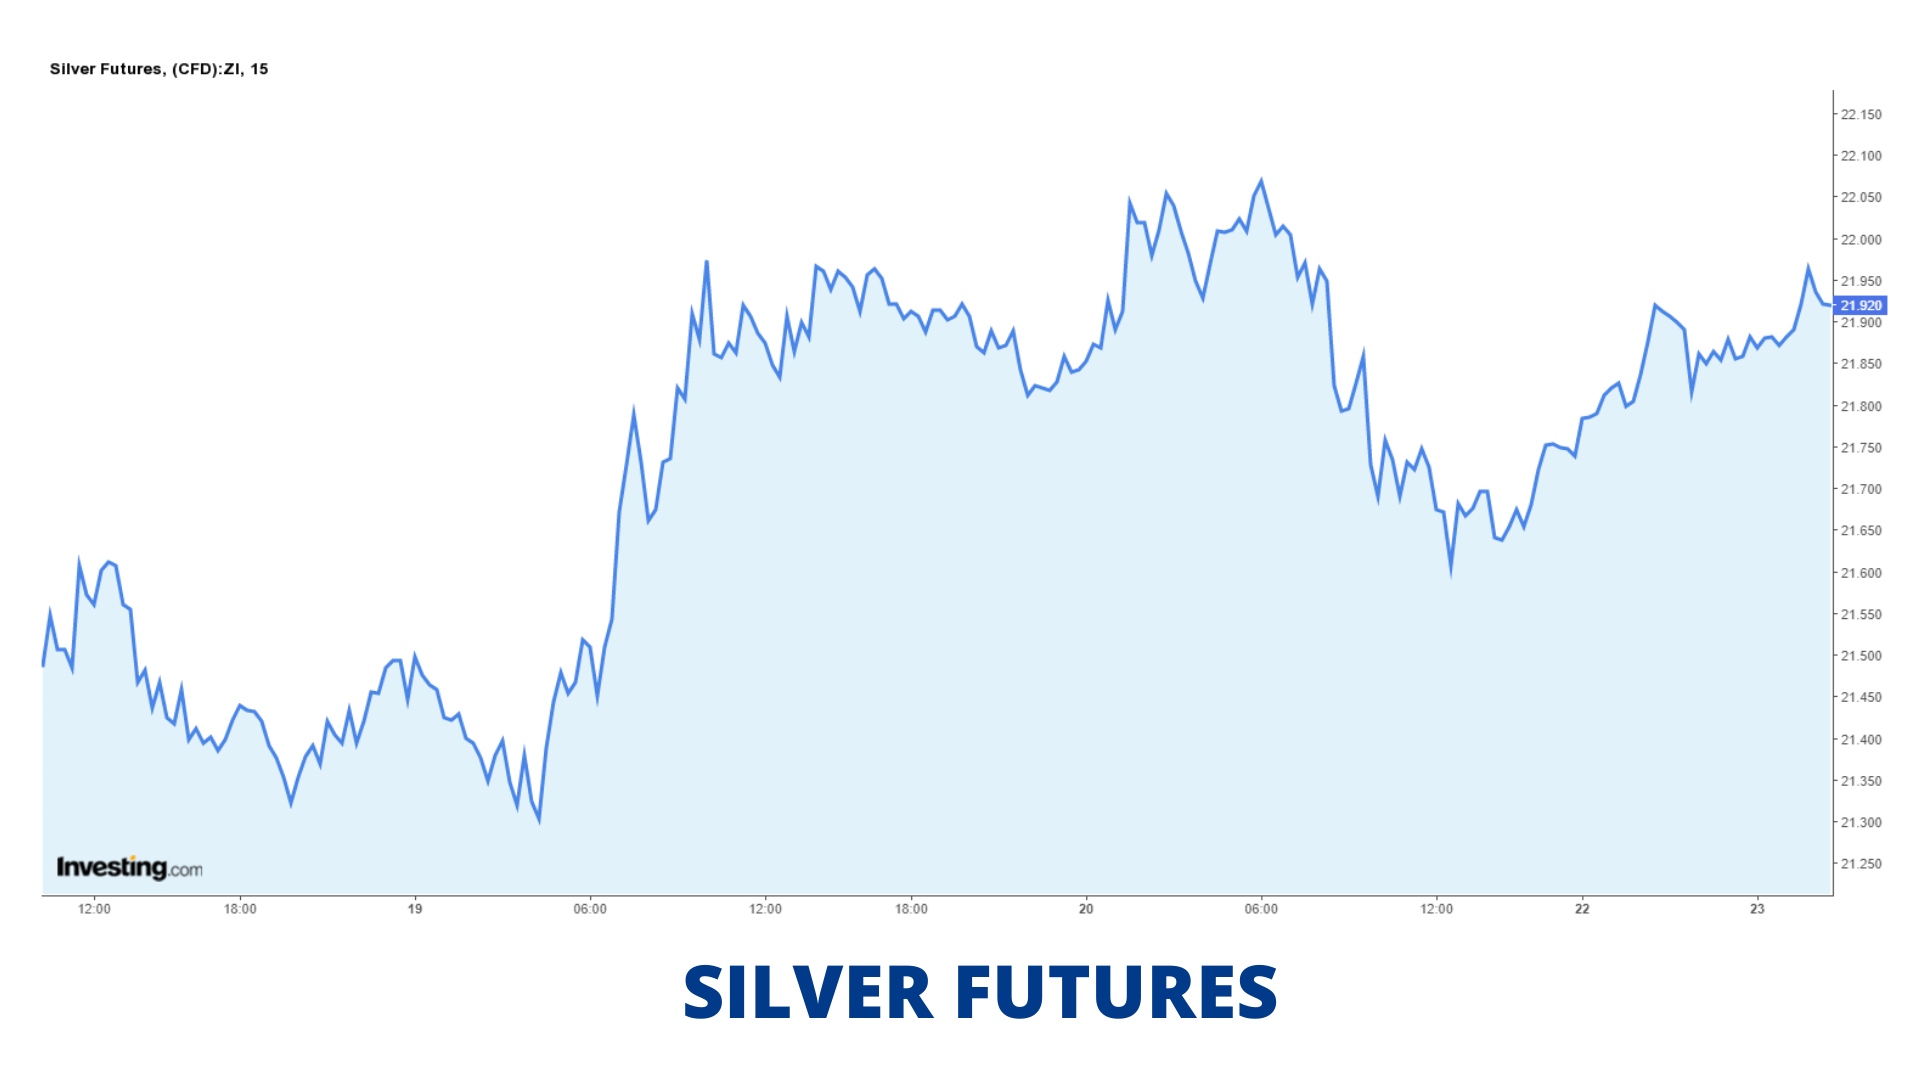
Silver Price Movement:
Trading and Conversion:
- Silver is predominantly traded on the London Bullion Market Association (LBMA) and COMEX in New York.
- Silver is invariably quoted in US dollars per troy ounce.
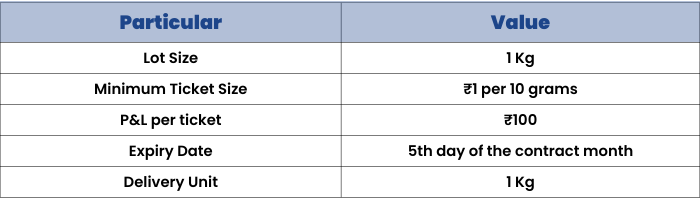
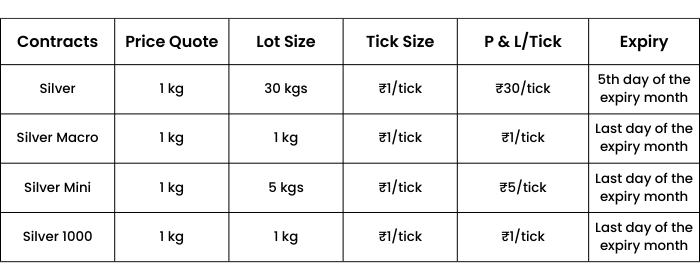
- Contract specification on MCX:
* Symbol: SILVER
* Trading Unit: 30kg
* Maximum order size: 600kg
* Tick Size: Re.1 per kg - Conversion factor: 1 kilogram = 32.15 troy ounce.
- Conversion Calculation: Comex Silver price * 32.15 * INR Currency.
Example: Comex Silver future stands at 14.040 and INR Currency is at 49.6200, the price for 1 kilogram =₹14.040 * 32.15 * 49.6200.
= ₹22398.29/kilogram.
Apart from the primary silver contract, there are 2 other silver contracts available on the exchanges:
1.Silver Mini
- Symbol: SILVERM
- Trading unit: 5 kg
- Maximum order size: 600 kg
- Tick Size: ₹ 1 per kg
2.Silver Micro
- Symbol: SILVERMIC
- Trading unit: 1 kg
- Maximum order size: 600 kg
- Tick Size: ₹ 1 per kg
All the silver contracts mentioned above trade on MCX.
The timing of the exchange is Monday to Friday: 09:00 A.M. to 11:30 P.M.
These contracts differ from each other in terms of prices and liquidity, just like gold contracts.
Out of all the 4 silver contracts, Silver and Silver mini are the most actively traded.
Crude Oil
Here in this section, we will discuss Crude oil, which is under the classification of energy.
Crude oil is a mixture of hydrocarbons that exists in a liquid phase in natural underground reservoirs.Oil and gas account for about 60% of the total world's primary energy consumption.
Almost all industries including agriculture are dependent on oil in one way or another. Oil & lubricants, transportation, petrochemicals, pesticides and insecticides, paints, perfumes, etc. are largely and directly affected by the oil prices.
Aviation gasoline, motor gasoline, naphtha, kerosene, jet fuel, distillate fuel oil, residual fuel oil, liquefied petroleum gas, lubricants, paraffin wax, petroleum coke, asphalt and other products are obtained from the processing of crude and other hydrocarbon compounds.
The prices of crude are highly volatile ‒ High oil prices lead to inflation that in turn increases input costs; reduces non-oil demand and lower investment in net oil-importing countries.
Factors Affecting Crude Oil:
1.Periodic Global Demand Forecasts by IAEA, the Energy Agency.
2.The Consumer Confidence Index is the largest consumer of Oil in the world, the U.S
3.Weekly Inventory Levels as reported by the respective watchdog agencies.
4.Geo-Political tensions affecting the main producers of the commodity.
5.Political Instability prevailing in Nigeria, one of the largest producers of Crude Oil.
6.Price of Dollar which directly affects the purchasing power of the world.
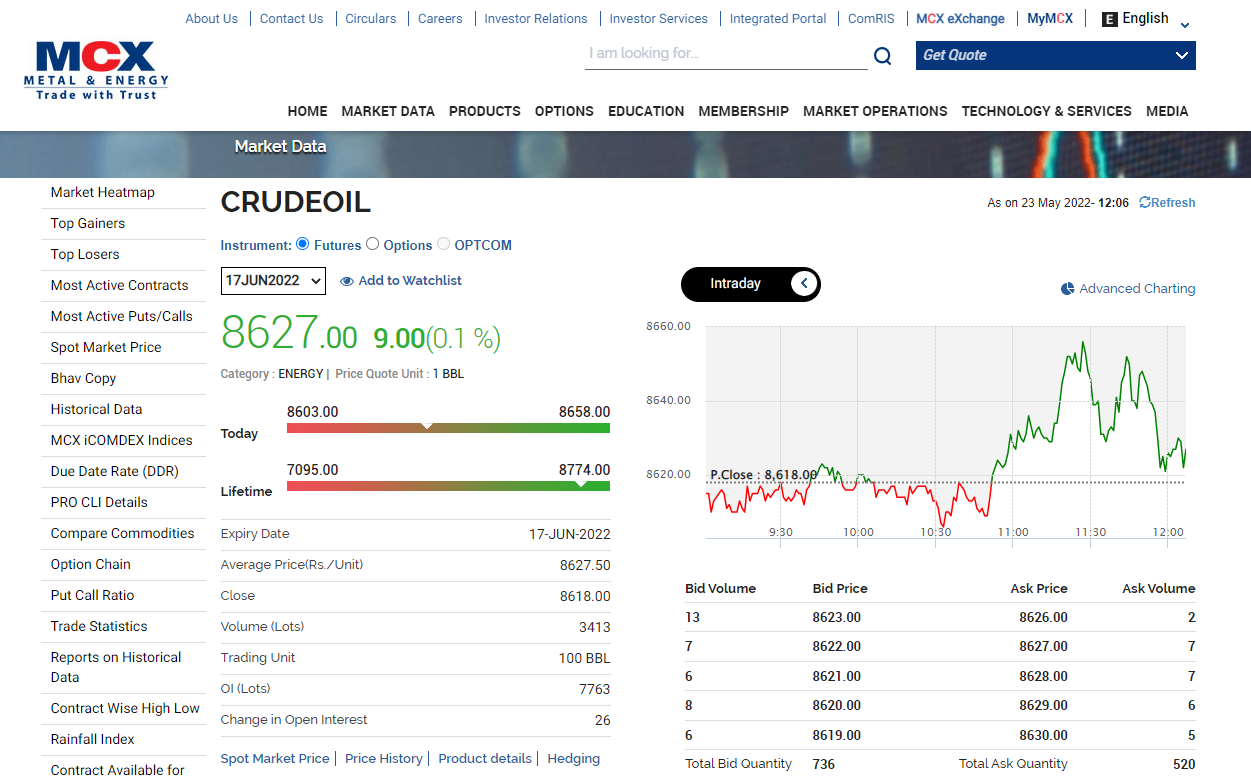
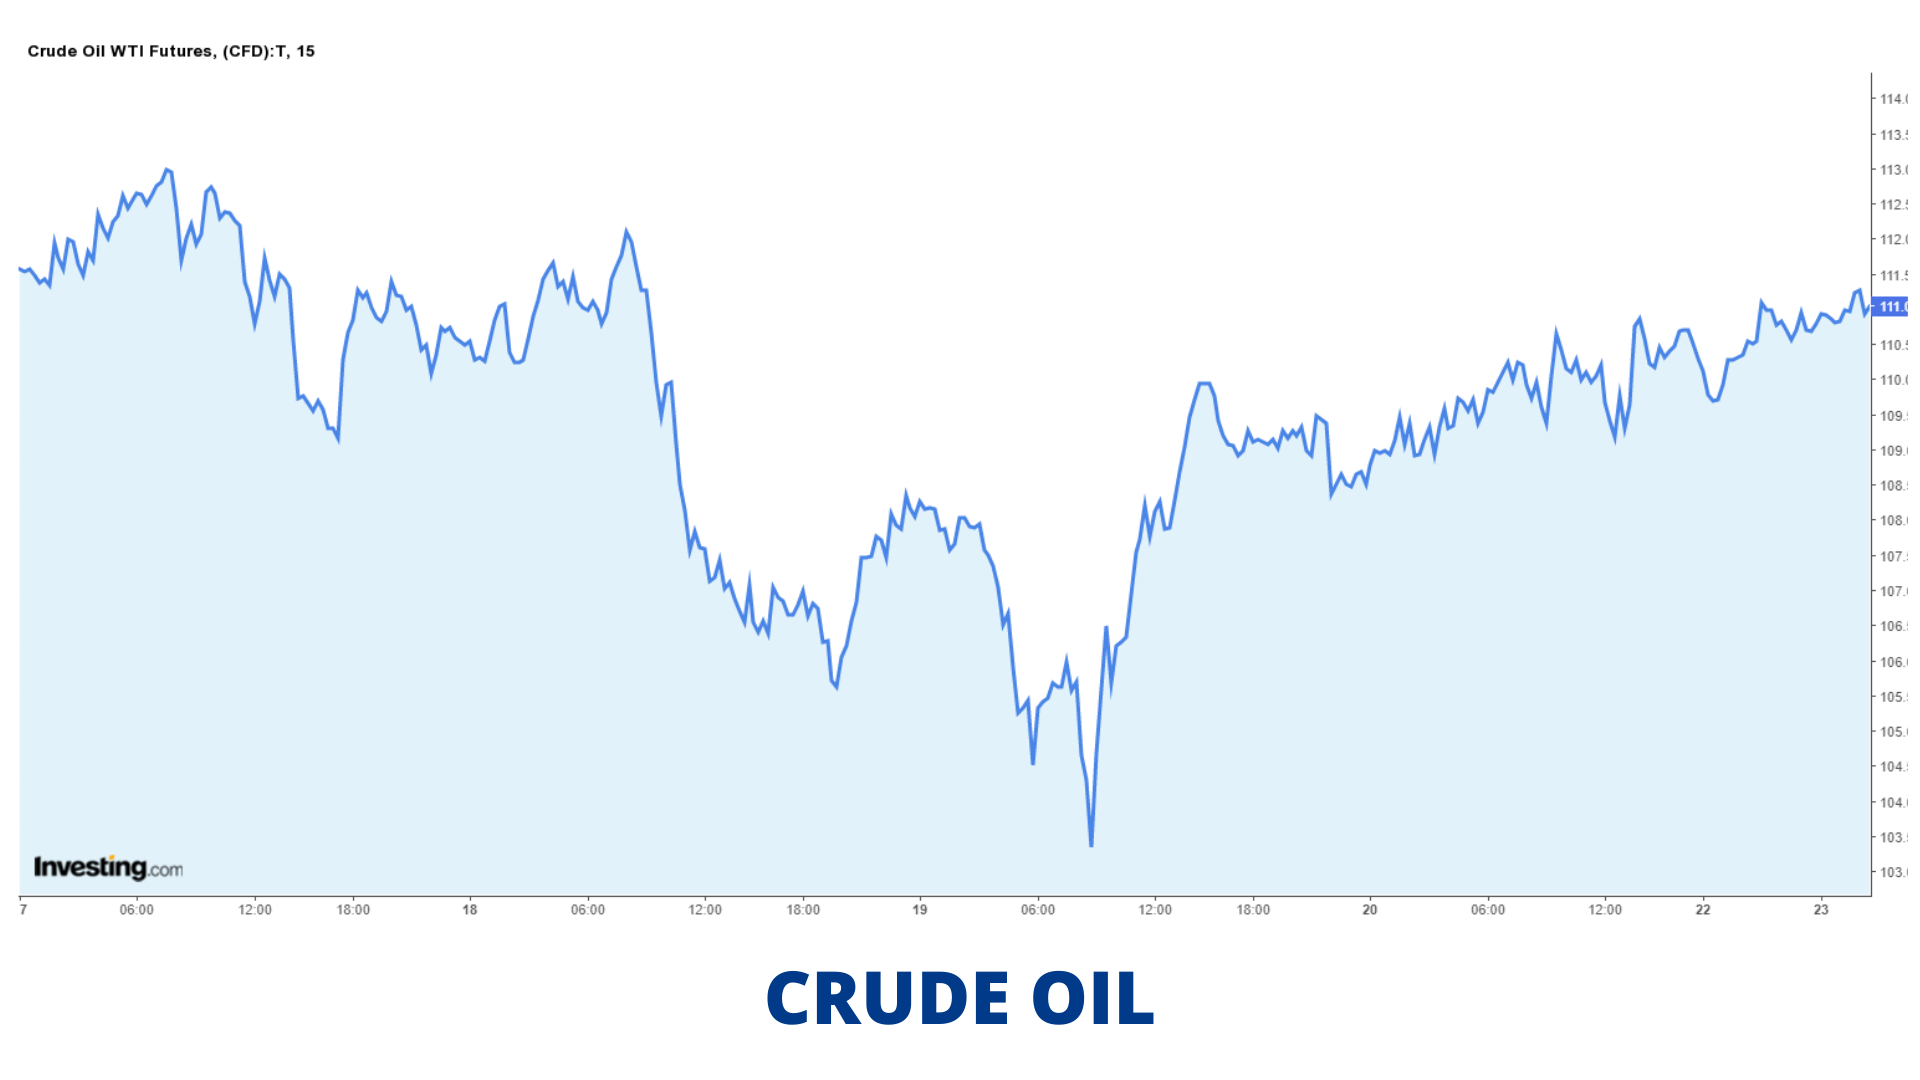
Crude Oil Price Movement:
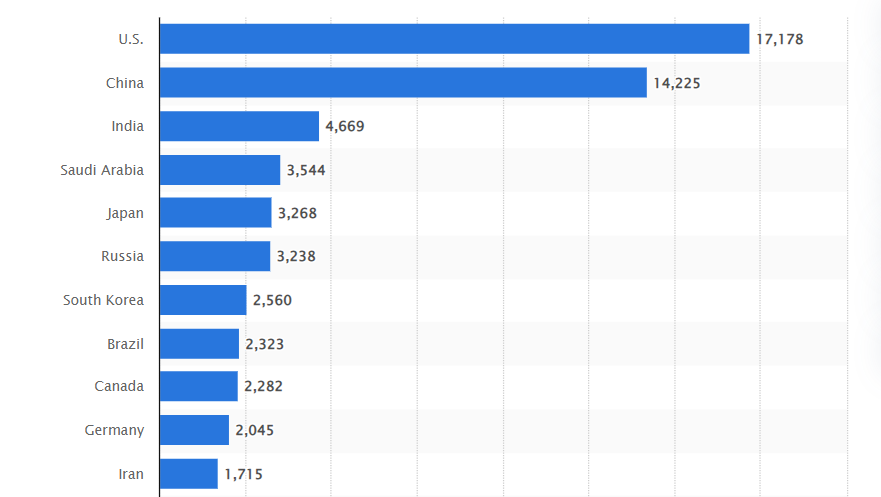
Top Crude Oil Consumers:
Trading & Conversion:
- Crude oil began futures trading on the NYMEX in 1983 and is the most heavily traded commodity.
- Crude Oil Futures trade in units of 1,000 U.S. barrels (42,000 gallons).
- Crude Oil Futures are quoted in dollars and cents per barrel.
- Minimum Price Fluctuation: $0.01 (1¢) per barrel ($10 per contract but in options no price limit.
- TThere is strict grading and inspection of the crude oil and delivery is done through pipelines pre-determined by the buyer, seller and exchange.
- Unit in which WTI Crude is quoted: USD / barrels.
- Conversion Calculation: Nymex Crude price * INR Currency.
- Example: Nymex Crude future stands at 58.54 and INR Currency is at 49.6075, the price for 1 barrel
= ₹58.54 * 49.6075
= ₹2904.02/barrel
Crude Oil trades on the MCX platform.
The timing of the exchange is Monday to Friday: 09:00 A.M. to 11:30 P.M.
Copper
From this section onwards, we will discuss a few popular commodities that fall under the classification of base metals. So, first, let us start with Copper.
Copper (chemical symbol - Cu) is a malleable and ductile metallic element that is an excellent conductor of heat and electricity. It is also corrosion-resistant and antimicrobial. It stands at the 3rd place in the context of world consumption after steel and aluminum.
Copper is highly traded in the market, and is one of the most recycled of all metals. It is our ability to recycle metals over and over again that makes them a material of choice.
Factors Affecting Copper:
- Economic events such as national industrial growth, global financial crisis, recession, and inflation all affect copper prices.
- Commodity-specific events such as the construction of new production facilities or processes, new uses or the discontinuance of historical uses, unexpected mine or plant closures, supply disruption, accident, strike, and so forth), or industry restructuring, all affect copper prices.
- Governments set trade policy (implementation or suspension of taxes, penalties, and quotas) that affect supply by regulating (restricting or encouraging) material flow.
- Geopolitical events involving governments or economic paradigms and armed conflict can cause major changes.
- There is also a national economic growth factor. Societies, as they develop, demand copper in a way that depends on their current economic position.
- Natural calamities such as Earthquakes/Floods which directly affect the production capacity of the mines which extract copper.
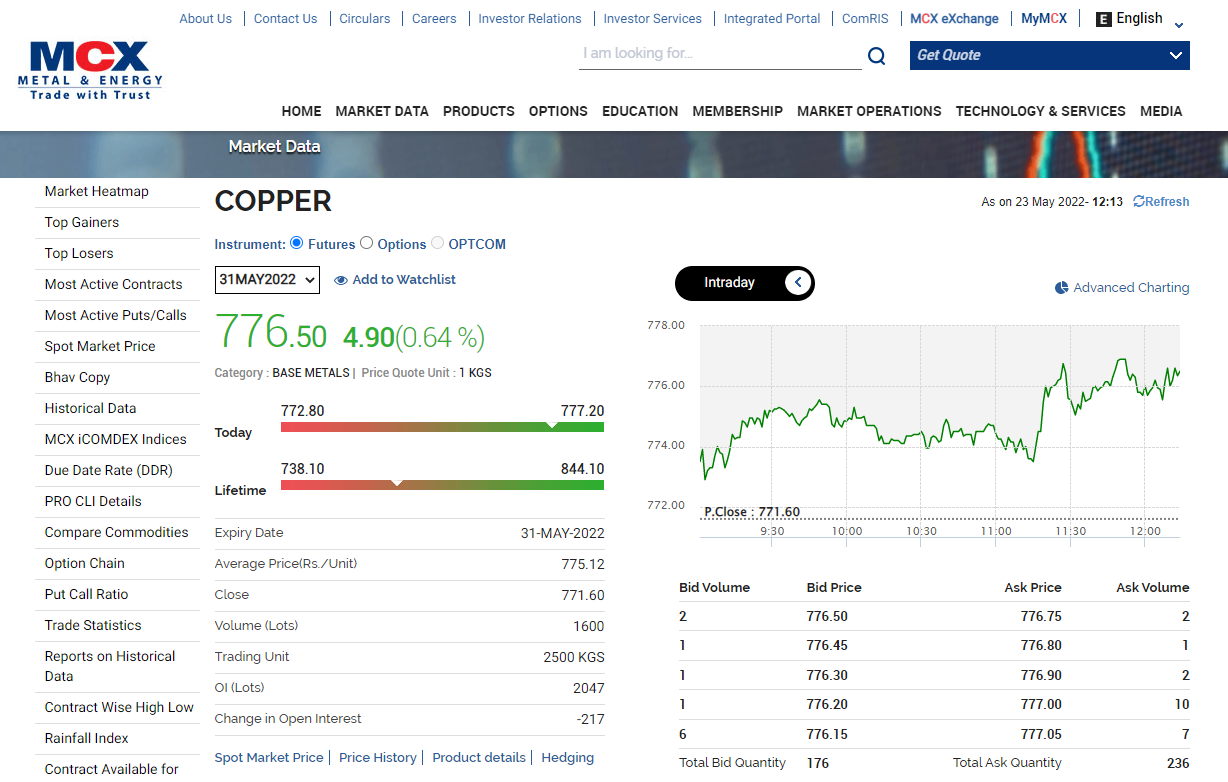
Copper Price Movement:
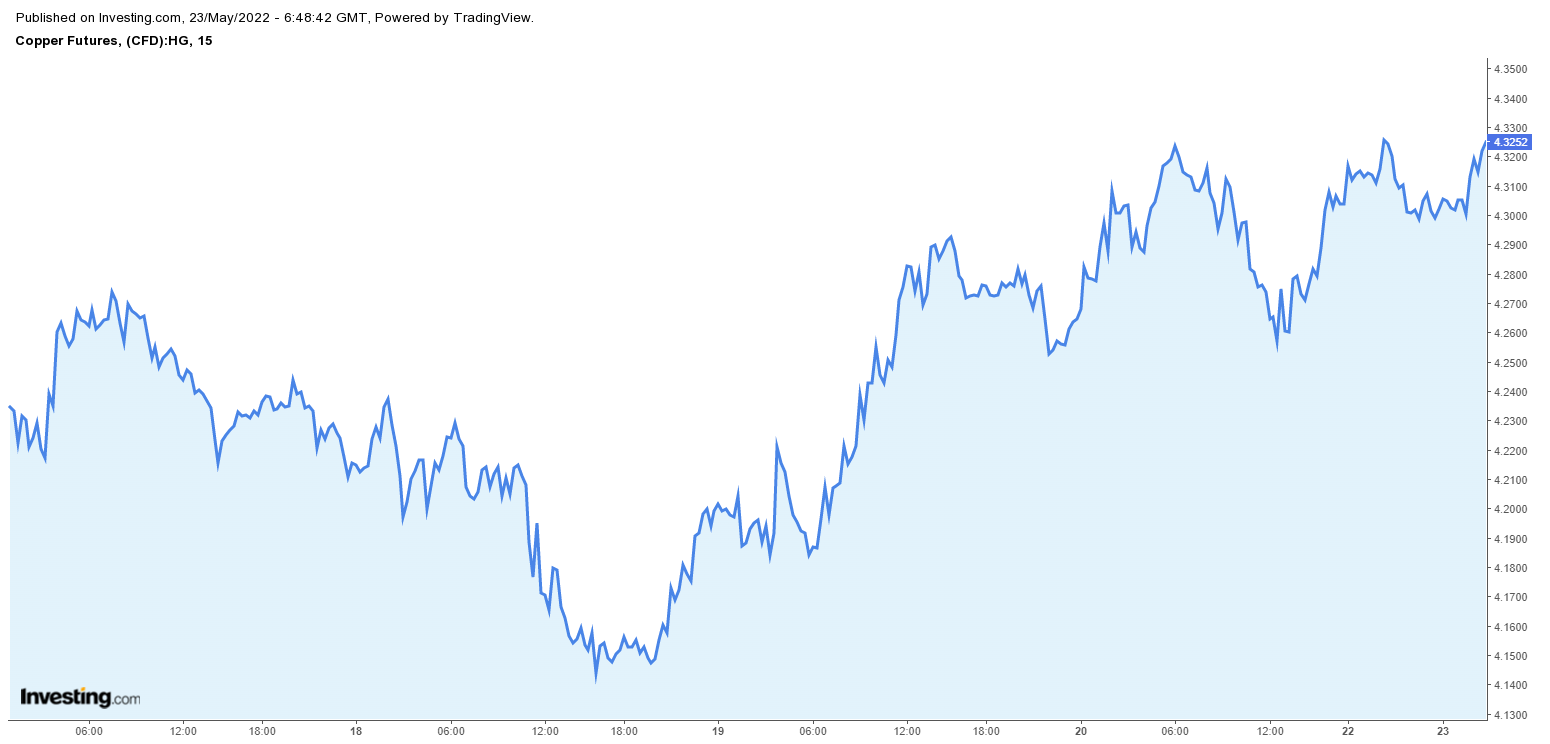
Trading and Conversion:
- Unit in which LME Copper is quoted as - USD/metric tonne
- Symbol: COPPER
- Trading unit: 1 MT
- Maximum order size: 70 MT
- Tick size: 5 paise per kg
- Conversion factor: 1 kilogram = 0.001 metric tonne
- Conversion Calculation: LME Copper price * 0.001 * INR Currency
- Example: LME Copper future stands at 4440 and INR Currency is at 49.6125, the price for 1 kilogram = ₹4440 * 0.001 * 49.6125
= ₹220.28/kg - Copper Mini
* Symbol: COPPERM
* Trading unit: 250 kgs
* Maximum order size: 70 MT
* Tick Size: 5 paisa per kg
Copper trades on the MCX platform.
The timing of the exchange is Monday toFriday: 09:00 A.M. to 11:30 P.M.
Nickel
Nickel (NI) is a silver - white metal with a golden tinge. Nickel is used in various industries such as engineering, electrical, infrastructure, automobile, packaging, etc. Nickel is a very volatile commodity because of its high demand and low supply.
Factors Affecting Nickel:
- Nickel finds its usage in various industries such as engineering, electrical and electronics, infrastructure, automobile and automobile components, packaging, batteries.
- Among base metals, Nickel is the most volatile owing to its strong demand and tight supply.
- Nickel demand is derived demand based on the growth of the industrial sector. Thus, it exhibits high volatility
- About 65% of nickel is used in the manufacture of stainless steels, and 20% in other steel and non-ferrous including "super" alloys, often for highly specialized industrial, aerospace and military applications.
Nickel Price Movement:
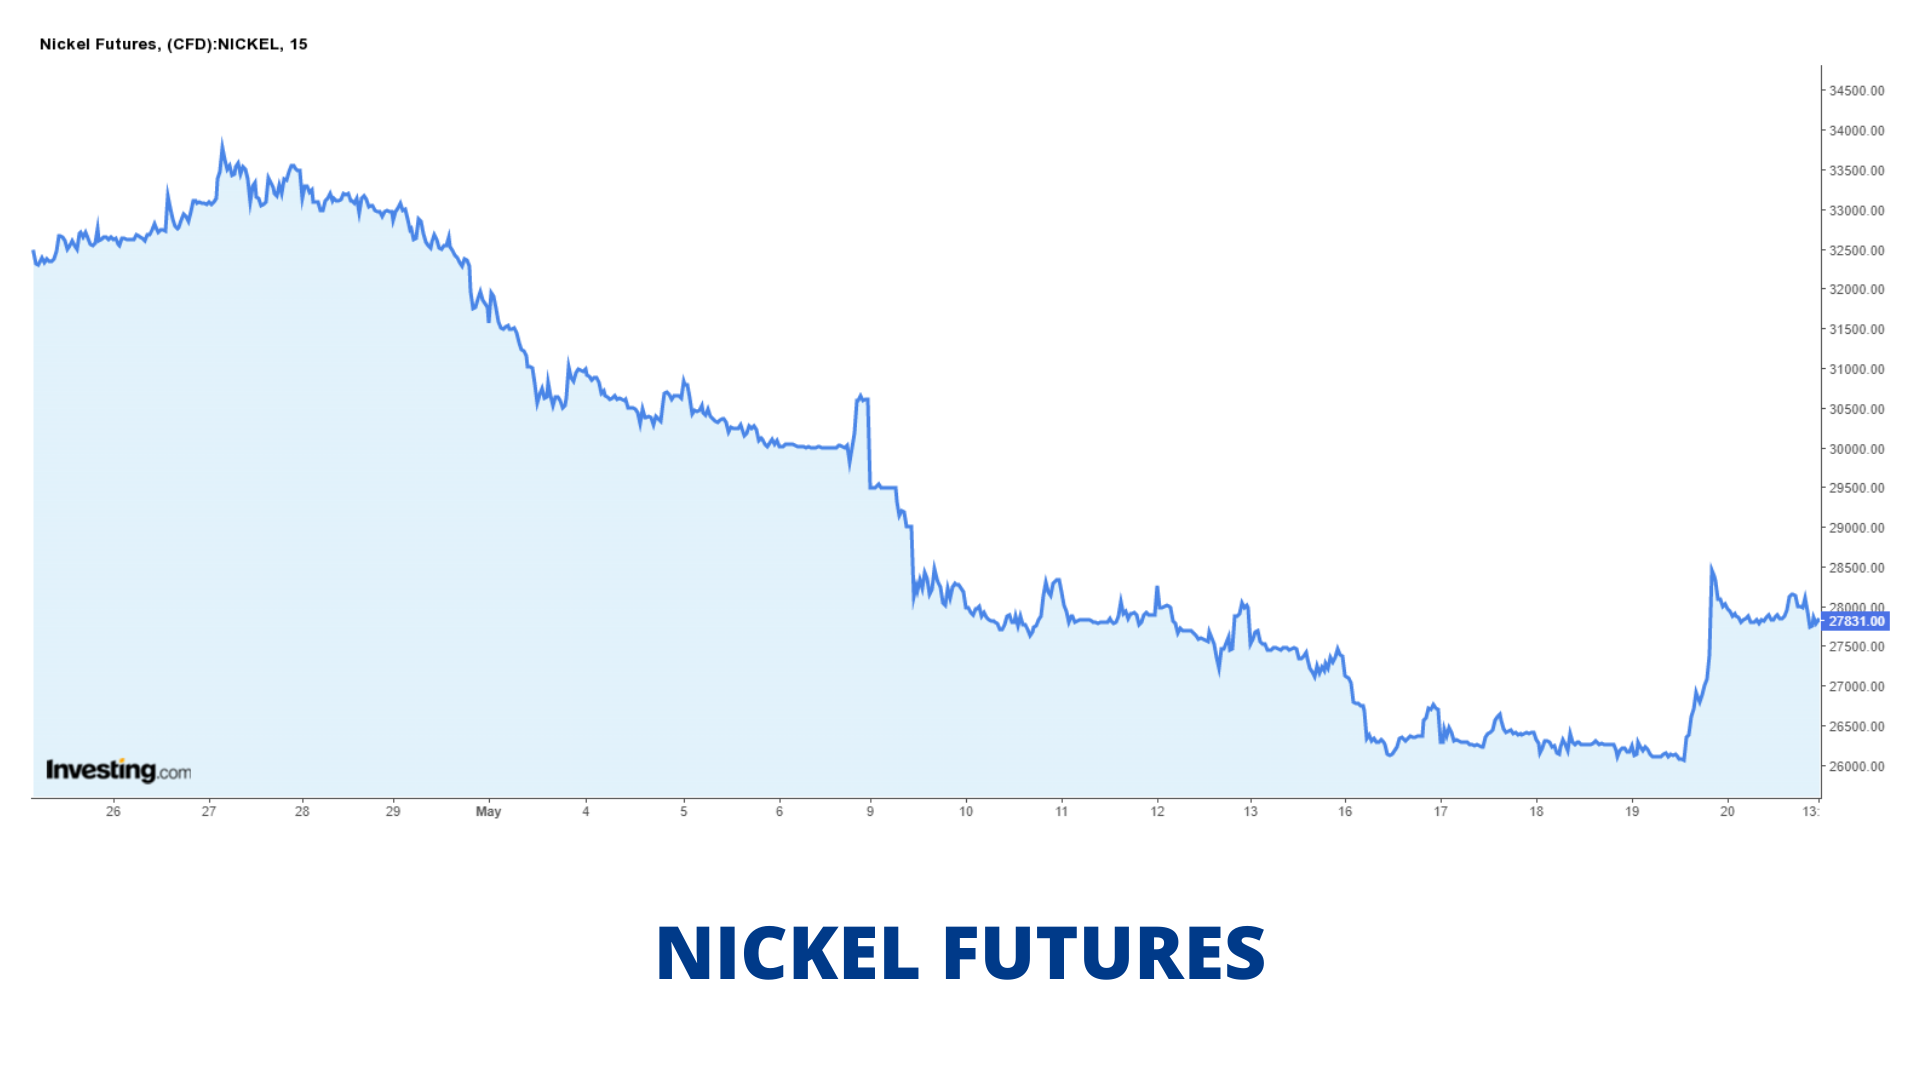
Demand and Contract Specification:
- Major producers of Nickel are Russia, followed by Australia, Canada, New Caledonia and Indonesia, which represents over 65% of total world production.
- Nickel market in India is of total import-dependent, with growth in the stainless steel sector Nickel import demand is expected to increase in the coming years.
- Symbol: NICKEL
- Trading unit: 250kg
- Maximum order size: 24 MT
- Tick size: 10 paise
Nickel trades on the MCX platform.
The timing of the exchange is Monday to Friday: 09:00 A.M. to 11:30 P.M.
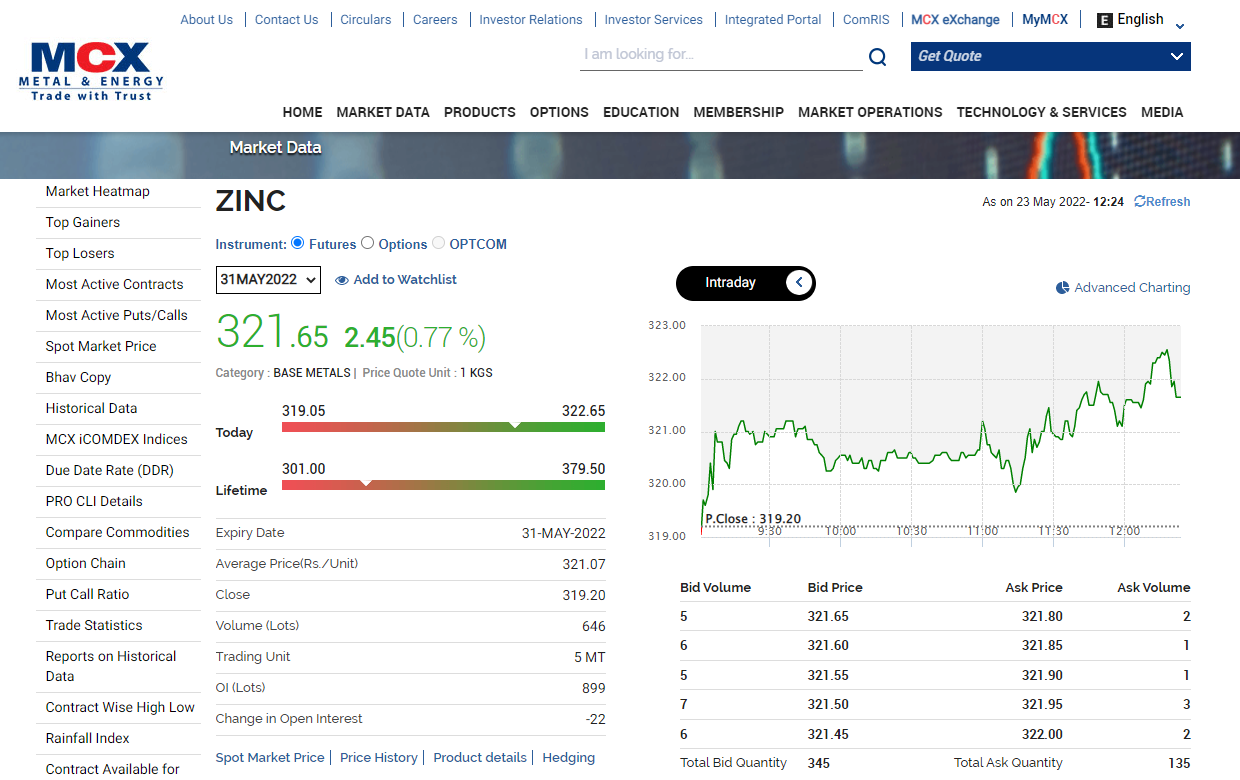
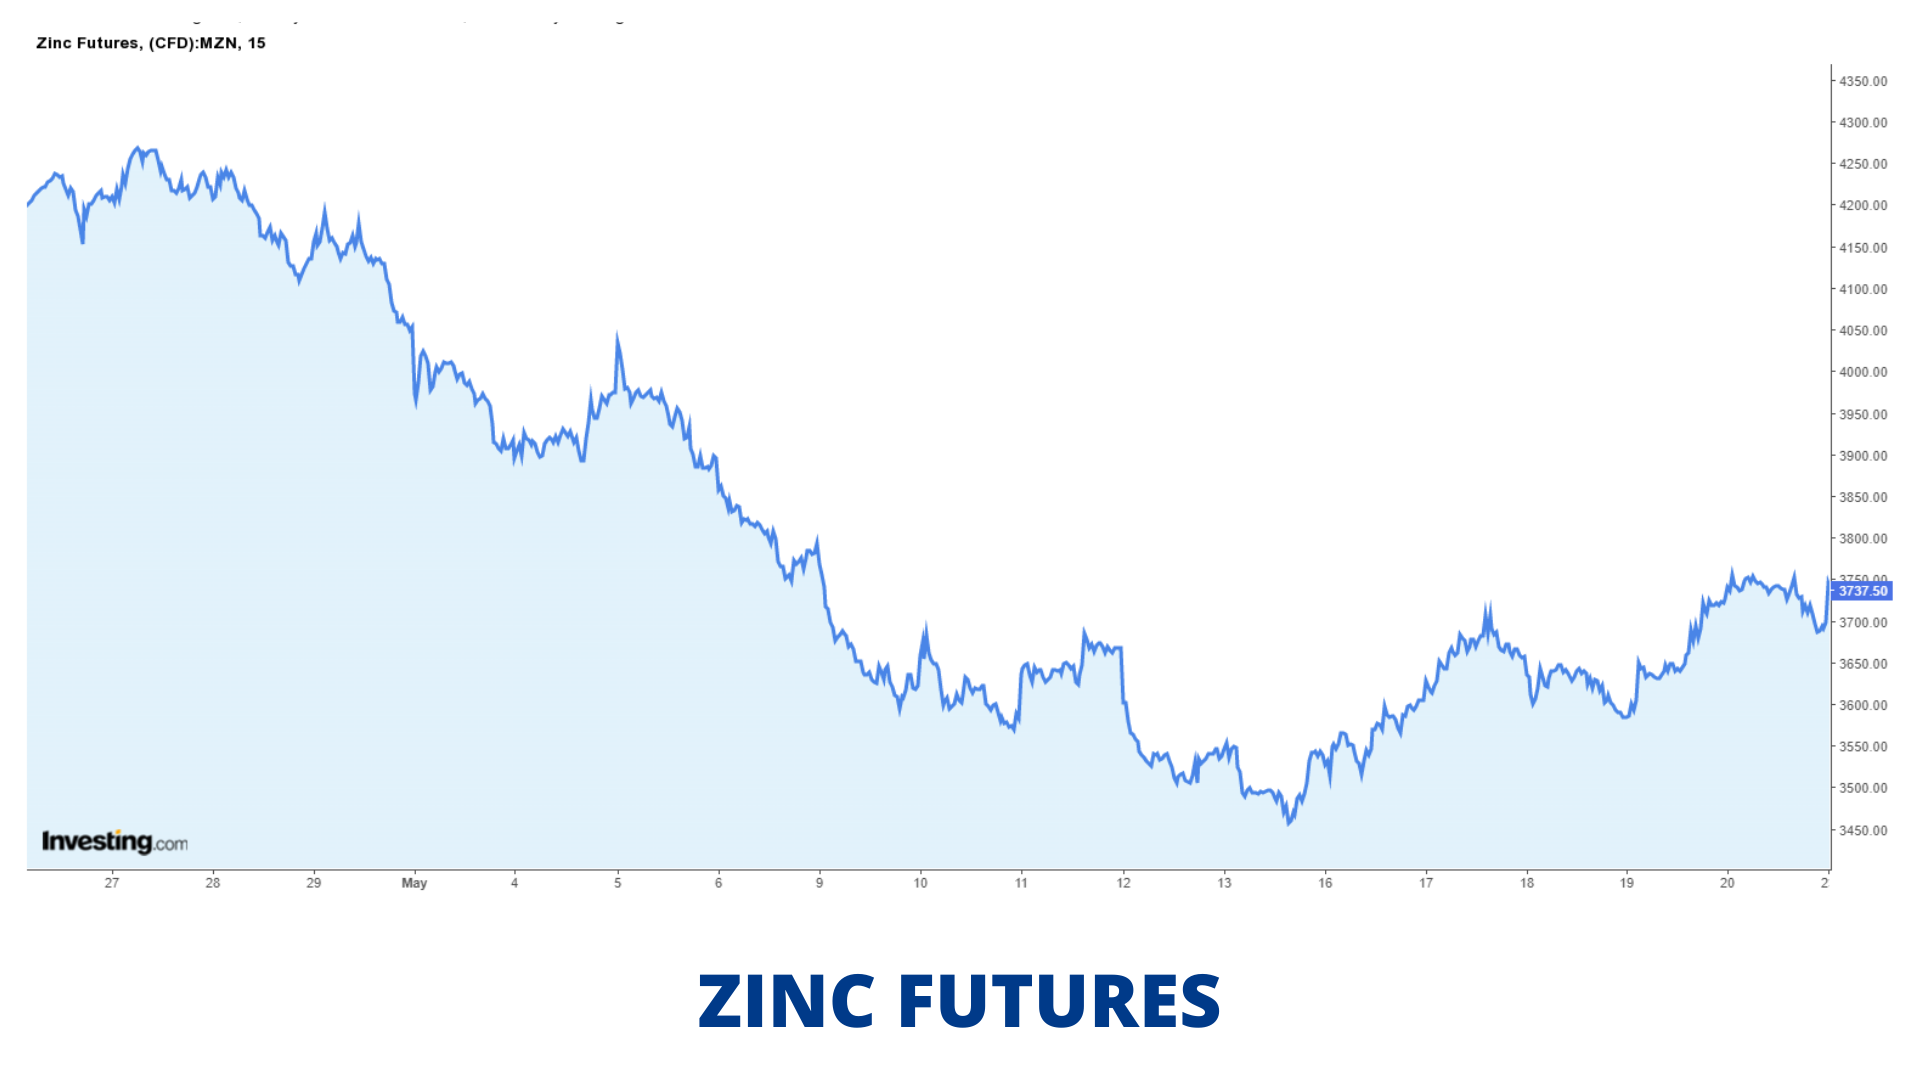
Zinc
Zinc (chemical symbol- Zn) is a bluish-white lustrous metal. It is normally covered with a white coating on exposure to the atmosphere.
It is the 4th most common metal in use behind iron, aluminum and copper in terms of annual production. Zinc can be recycled indefinitely, without loss of its physical or chemical properties. The principal use of zinc in the Indian market is in the galvanizing sector, which currently accounts for an estimated 70% of the total production.
Factors Affecting Zinc Market:
- Zinc prices in India are fixed based on the rates that rule on the international spot market, and Rupee and US Dollar exchange rates
- Economic events such as national industrial growth, global financial crisis, recession, and inflation affect commodity-specific events such as the metal prices
- Construction of new production facilities or processes, new uses or the discontinuance of historical uses, unexpected mine or plant closures (natural disaster, supply disruption, accident, strike, and so forth), or industry restructuring, all affect metal prices.
- Governments set trade policy (implementation or suspension of taxes, penalties, and quotas) that affect supply by regulating (restricting or encouraging) material flow.
- Geopolitical events involving governments or economic paradigms and armed conflict can cause major changes.
- There is also a national economic growth factor. Societies, as they develop, demand metals in a way that depends on their current economic position.
Zinc Price Movement:
Contract Specification:
- Zinc
* Symbol: ZINC
* Trading unit: 5 tons
* Maximum order size: 100 tons
* Tick Size: 5 paise per kg - Zinc Mini
* Symbol: ZINCMINI
* Trading unit: 1 MT
* Maximum order size: 100 tons
* Tick Size: 5 paise per kg
Zinc trades on the MCX platform.
The timing of the exchange is Monday to Friday: 09:00 A.M. to 11:30 P.M.
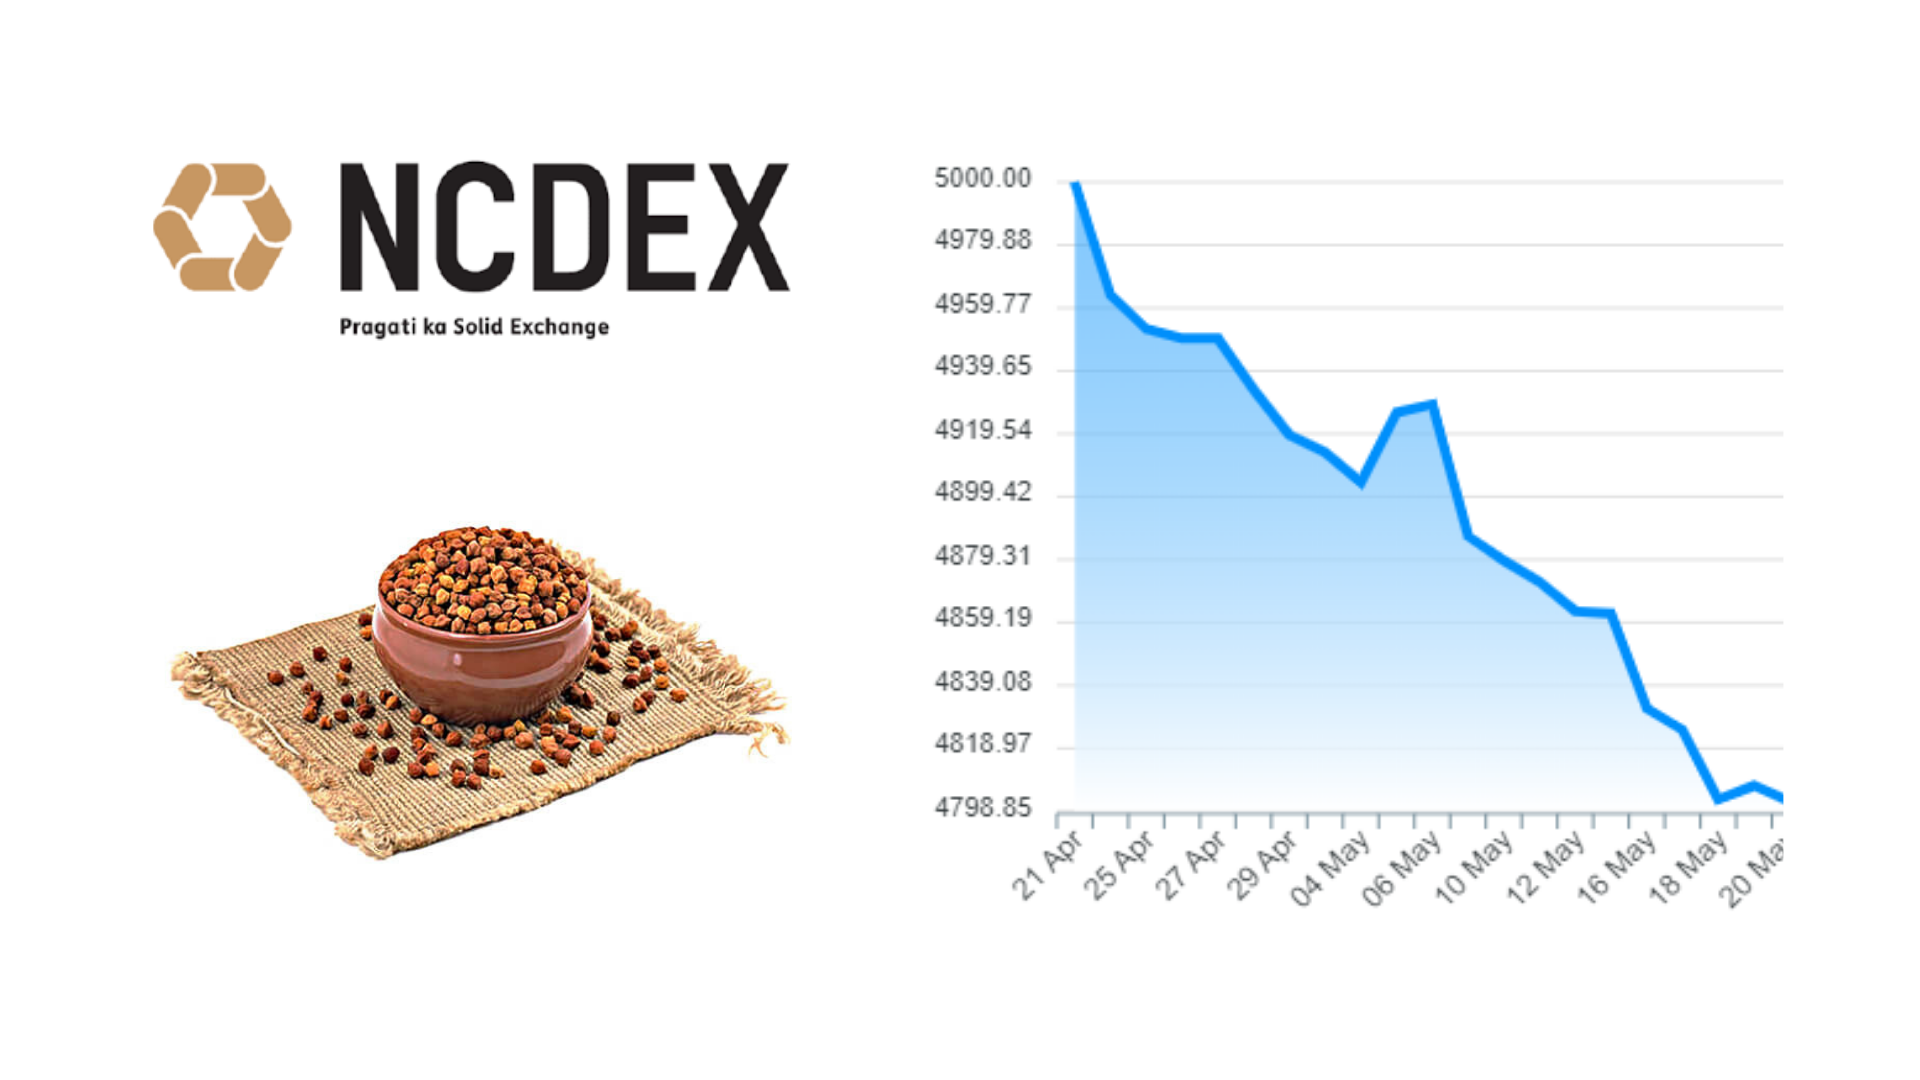
Chana
Finally, let us discuss a few Agri based commodities starting with Chana or Chickpea. It is a very important crop which has 25% protein. This is the maximum protein that any pulse can provide us Chana trades on the NCDEX platform.
The major Chana hubs are in Delhi, Madhya Pradesh, Uttar Pradesh, Maharashtra and Rajasthan.
Factors affecting Chana:
- The production of chana highly fluctuates in a year, depending on the rains received and the moisture availability in the soil.
- Imports and the crop situation in the countries from where imports originate, i.e., Canada, Australia, Myanmar, etc., affect the price of chana.
- There is high substitutability between pulses in India among the consumers. So the price of other major pulses like yellow peas, green peas, etc., also affect the price of a chana.
- The bid-ask spread also affects the prices of chana, higher the spread more the price and vice - versa.
Chana price movement:

Contract Specification:
- Chana
* Symbol: CHANA
* Tick Size: Rs. 10 per contract
* Contract Size: 10 MT
* Last Trading Day: 20th day of every month
* Trading Hours: 10:00a.m. - 5:00p.m. (Mon-Fri) (Sat 10:00a.m. - 2:00p.m.)
Soybean
Soybean is the single largest oilseed produced in the world.
About 82-85% of the global soybean production is crushed for oil and meal, while the rest is consumed either in the form of bean itself or for value-added soybean snack foods.
USA, Brazil, Argentina, China and European Union countries constitute for the bulk of the world's annual soybean consumption. Mexico, Japan, India and Taiwan are among the other major consumers.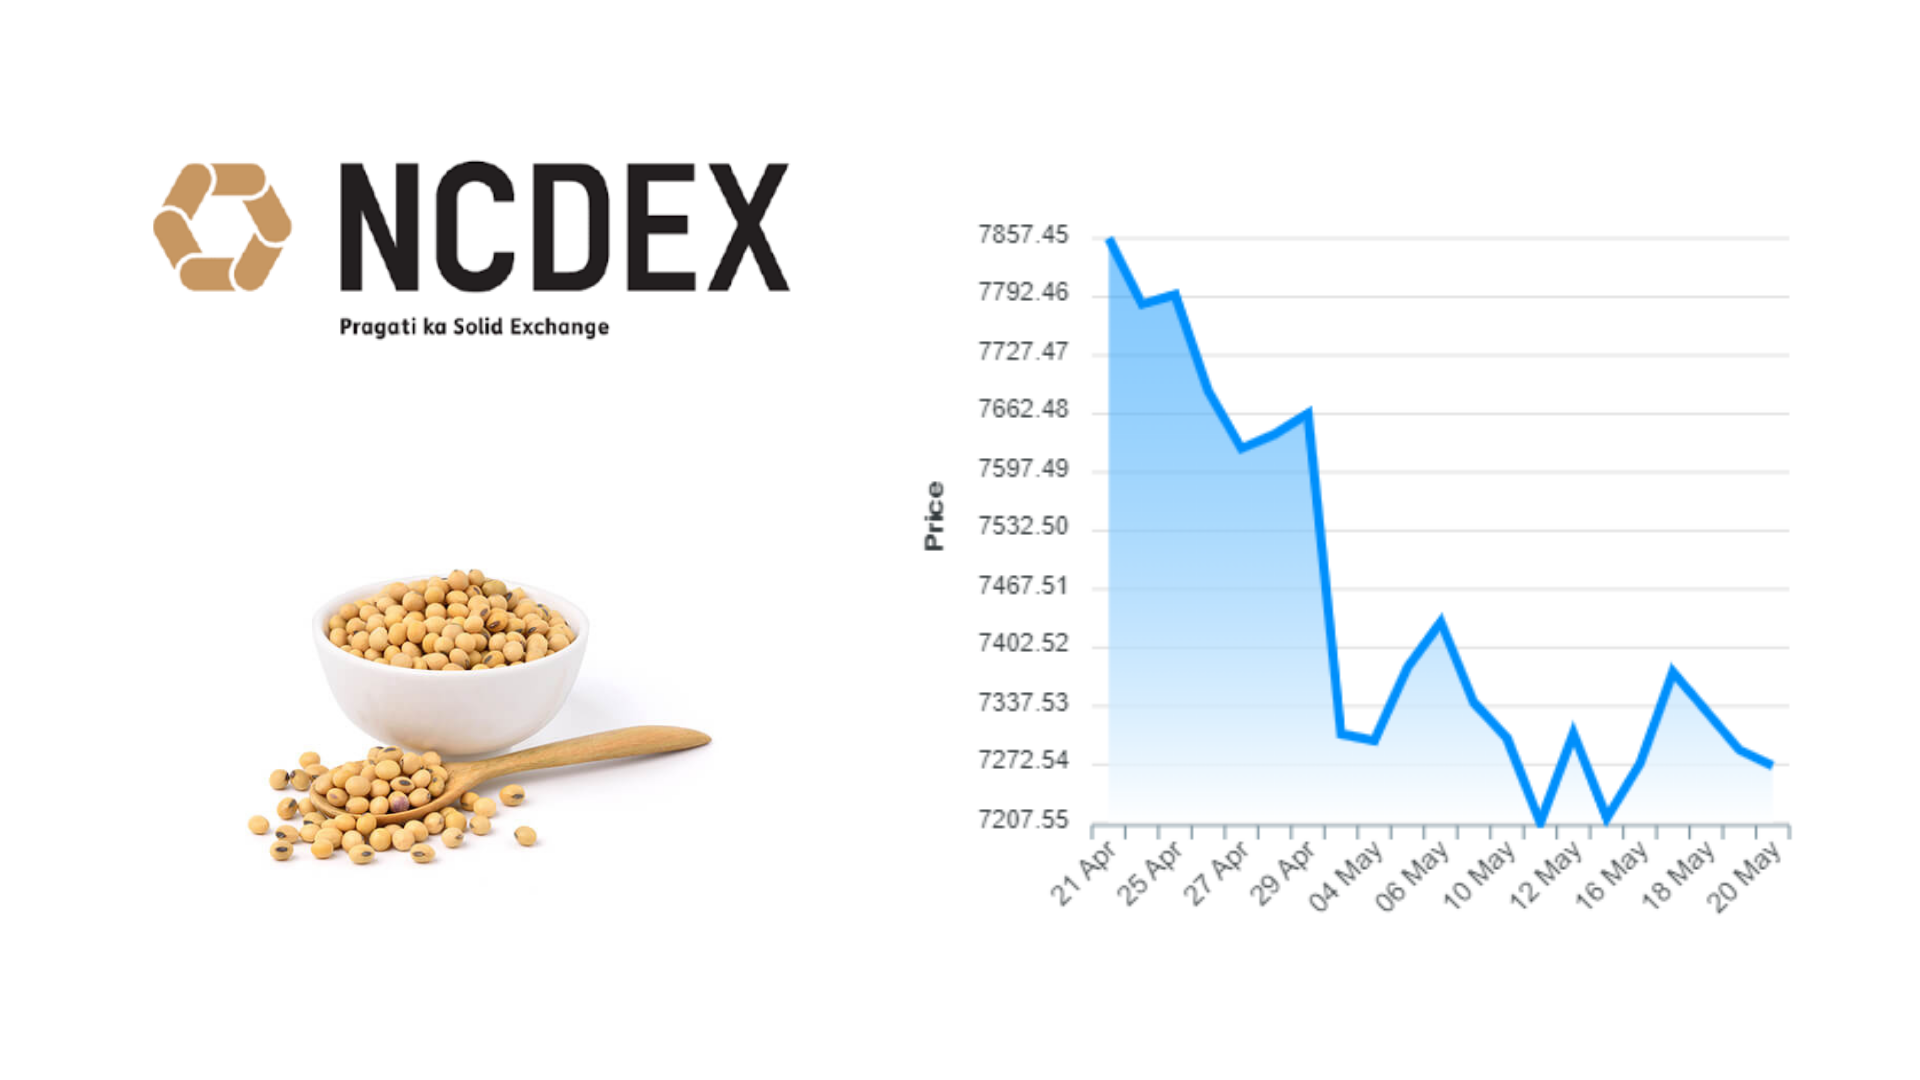
Factors Affecting Soybean:
- Prices are affected by the fluctuations in demand and supply throughout the year.
- Transportation costs are a major factor when it comes to the determination of soybean prices.
- Soybean price movement:
Soybean Price movements:

Contract Specification:
- Soybean
* Symbol: SYBEANIDR
* Tick Size: Rs.100 per contract)
* Contract Size: 10 MT
* Last Trading Day: 20th day of every month
* Trading Hours: 10:00a.m. - 5:00p.m. (Mon-Fri) (Sat 10:00a.m. - 2:00p.m.)
* Exchange: NCDEX
Conclusion
So at the end of this module, we have completed our journey to understand the overall commodity market. As we have tried to explain the basic concept of the commodity market in India, we hope you are ready to take your first step in commodity trading. There are other modules on different topics of financial markets that we have designed on ELM School so that you can attain financial literacy.


