Introduction
About the book
The book 'Coffee Can Investing' is for those people who are looking to learn how to invest in the stock market and generate impressive returns with low volatility and transaction cost.
Although there is no shortage of great books on Finance and Investments by global Gurus, a book on investing in the Indian context is not easily available.
It also explains that most average investors in India make a measly 8 to 12 % per annum on their investments or might end up losing a lot of money, but this book teaches you a unique method of investing that could make not 10 not 15 but 20 % compound annual growth rate (CAGR) on your investments.
About the author
The author of this book Mr Saurabh Mukherjea is the founder and CIO of Marcellus Investment Managers. He graduated from the London School of Economics and is a CFA charter holder. Previously, he was the CEO of Ambit Capital, an Indian investment bank. He was rated the leading equity strategist in India in polls conducted by Asiamoney in 2014, 2015 and 2016. He has authored five books till now.
Buy the book
The book teaches you to identify quality stocks that have low risk and generate high returns over a long time. We highly recommend you to read the entire book. (affiliate link)
Mr. Talwar’s Uncertain Future
In this chapter, we see 2 people, Mr. Talwar and Mr. Sanghvi, who had pretty successful careers, but their financial situation was almost the same when they had started their careers. They have bad spending habits and are coming close to their retirements.
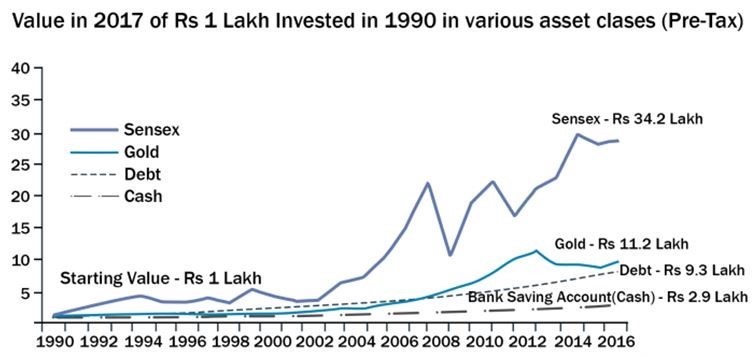
They meet Nikhil, a financial advisor, who suggested that they should invest in equity for long periods of time. To show the benefits of investing in equity, Nikhil says that if someone had invested ₹1 lakh in equity in 1990, it would have been valued at ₹34.2 lakhs in 2017.
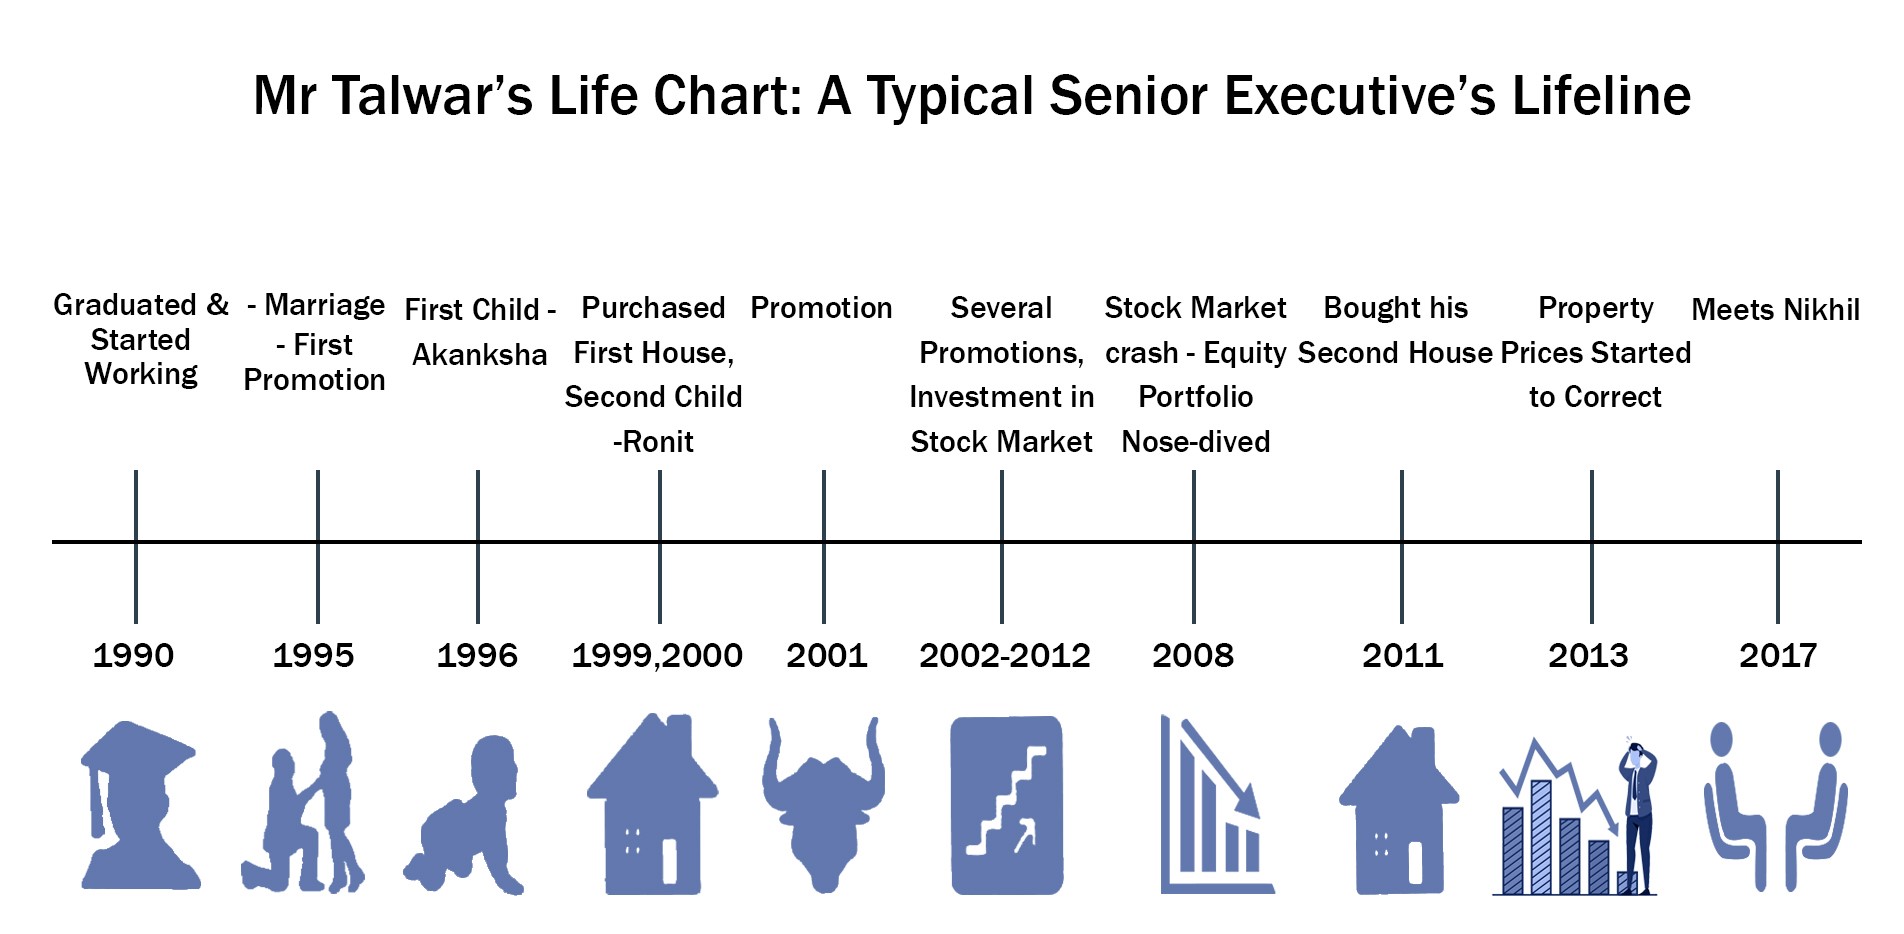
A typical senior executive’s (Mr.T's) lifeline:
A typical manufacturing businessman’s (Mr.S’s) lifeline:

Secure your financial future with Mr. Talwar's expert guidance. Enroll now for the Advanced Commodity & Currency Trading Masterclass!
As Nikhil continues to talk to Mr. Talwar and Mr. Sanghvi, he offers some advice which if we can follow, can help us to make better decisions:
- Quantify everything since reality is different from perception and hard numbers help to differentiate one from the other.
- Quantify your net worth.
- Check your current portfolio returns. (Mr. Talwar, on a weighted average basis, earned a return of only 4% per annum over 17 years).
- Write down your financial goals with the current equivalent goals, inflation-adjusted. At 8% inflation and 4% growth, the standard of living will come down drastically, and ultimately, you will have to compromise on the quality of your life.
- To fulfill all the financial goals of Mr. Talwar, the portfolio needed a 21% return on a post-tax basis.
- The need was to revise the goals to pragmatic levels, reduce the frequency of vacations, etc. The new required rate of return was 16% per annum.
- After his blunders in real estate and speculation, the only solution for Mr. Talwar was to ‘use the power of equity’.
- Mr. Talwar conducted some Classic Mistakes while dealing with equity.
Mistakes While Equity Investing By Mr. Talwar
a.Trading heavily:
Mr. Talwar had an average holding period of 4 months and his holdings didn’t last more than 8 months. This meant he was paying up to 7% of his portfolio value each year in the form of brokerages. There is no way to generate good returns if you trade this heavily.
b.Trying to Time the markets:
An irregular investor who always tries to time the market, i.e., buy at low and sell at high, isn’t able to gain much when compared to a regular investor.
Mr. Talwar invested as and when he saw opportunities which meant that he ended up entering the stock market when the market was peaking and exiting when the market was bottoming.
The only way to consistently make Returns was in fact to stay invested.
Patience and discipline in equity investing was the solution to this problem.
After this, Mr. Talwar decided to invest 80% of his Corpus into equity
Seven Common Mistakes Of Investment
1.No clear investment objective/plan:
“If you don’t know where you’re going, you will probably end up in the wrong place”.
Financial goals should be written and not based on rumors or tips from others.
2.Trading too much too often:
Too many people trade too much, and hence do not reap the benefits of long-term investing. Buying and selling stocks continuously might be fun, but what we don’t realise is that repetitive trading leads to lower returns and higher transaction costs.
3.Lack of diversification:
As we all know, different classes of assets carry different kinds of risks and return potential.
Diversifying our portfolios can lead us to insulate ourselves from shocks in a particular asset class.
Moreover, adequate diversification is required for long-term wealth creation.
4.High commission and fees:
It is very important to choose funds with low fees and commissions, else as we saw with Mr. Talwar, he ended up paying 7% annually in the form of brokerage commissions.
5.Chasing Short term Returns:
We should realise that a stock should be purchased on its future expectations and not on what was done in the past.
Do not be greedy and chase short-term profits.
As with Mr. Talwar and Mr. Sangvhi, both got greedy and actually lost money rather than making wealth.
6.Timing the markets:
There is no way one can accurately predict the future. Similarly, there are many indicators that can help us in identifying a trend, but there is no way to know which is the best entry and exit point of every single stock.
Timing the markets is hard and most people lose money in this game rather than making it.
7.Ignoring Inflation and Taxes:
Most investors look at nominal figures of their returns and ignore the inflation part. If you made 5% returns but the inflation growth in that year was 8%, it means that you made money, but lost your purchasing power.
In the following image, we can see that Gold has hardly delivered any returns when adjusted for inflation. The initial amount invested was Rs. 1 lakh.

‘The best time to plant a tree was twenty years ago. The second best time is now.’ -An ancient Chinese saying
Coffee Can Investing
Most Indians do not invest in equity at all, and those who do, do so in a very hazardous manner. The result is that the long-term gains from what is a very powerful asset class have eluded the majority of affluent Indians. Equity carries more volatility than other asset classes.
Warren Buffett’s choice of companies where he likes to invest in:
- A business that he understands.
- Favorable long-term economics.
- Able and trustworthy management.
- A sensible price tag.
- “A truly great business must have an enduring moat that protects excellent returns on invested capital” . There were many companies in business history whose Moats proved illusionary and were soon crossed by its competitors. “Though capitalism's creative destruction is highly beneficial for society, it precludes investment certainty. A moat that must be continuously rebuilt will eventually be no moat at all.”
- Long-term competitive advantage in a stable industry is what he seeks in a business,
- ‘When we own portions of outstanding businesses with outstanding management, our favourite holding period is forever.’ Just opposite of those who hurry to sell and book profit when companies perform well but who tenaciously hold on to the business that disappoints. ‘Peter Lynch aptly likens such behaviour to cutting the flowers and watering the weeds.’
Investing is simple but it is complicated by us.
Most of what Warren Buffett did was reading reports and trade journals that any small investor could also do. He felt very deeply that the common wisdom was dead wrong, the little guy could invest in the market so long as he stuck to his Graham and Dodd knitting.
In 1934, Benjamin Graham and David Dodd, came up with a method for selecting stocks, where they looked for stocks which went down significantly over the past periods. They looked for stocks which qualified the following criterias.
- Low P/E ratio,
- Price below its current book value,
- High dividend yield.
Akash Prakash, a very successful institutional investor who focuses on investing in India has 2 philosophies:
1. Trust the people who are running the company.
2. How long you hold on to a position. For good and clean companies, we should not sell the stocks that we own.
Our view is that there are a limited number of companies in India where everything lines up, i.e., a good business, capable and ethical management, an investor’s access to the management, etc. Such combinations are not available often.
Learning from the legendary investors, invest in high-quality companies and then sit tight for long (often very long) without losing sleep about where the share price is going.
Robust Returns With A Low Degree Of Uncertainty
Robert Kirby first introduced the concept of Coffee Can Portfolio. Kirby, an investment advisor, had an incident involving a client's husband. The gentleman purchased stocks recommended by Kirby in the nomination of $5,000. But unlike Kirby did not sell anything from that portfolio.
This process (of buying when Kirby bought but not selling thereafter), led to enormous wealth creation for the client over a period of about 10 years. The wealth created was mainly on account of one position transforming to a huge portfolio value of over $8 million, which came from holding shares of Xerox over a long time.
Impressed by this approach of 'buy and forget', Kirby coined the term “Coffee Can Portfolio”, a term in which the "coffee can" harks back to the Wild West when Americans before the widespread advent of banks, saved their valuables in a coffee can and kept it under a mattress.
The core takeaway behind this portfolio is that, in order to become rich, one has to let a sensibly constructed portfolio stay untouched for a long period of time.
In addition to this, an intelligent and hardworking investor tries and optimises a portfolio periodically, usually once a year.
“It is very hard for investors to leave a Portfolio untouched for 10 years. A retail investor will be tempted to intervene whenever he sees stocks in the portfolio sag in price.”
“A professional investor will feel that he has a fiduciary responsibility to intervene if parts of his portfolio are underperforming.”. Kirby's counter-intuitive insight is that an investor will make way more money if he leaves a portfolio untouched.
The Coffee Can Portfolio Comes To India Through Ambit
In the Indian context, we can build the coffee can portfolio using straightforward investment filters.
The filters are:
1. Identify 10-25 high-quality stocks and then leave the portfolio untouched for a decade.
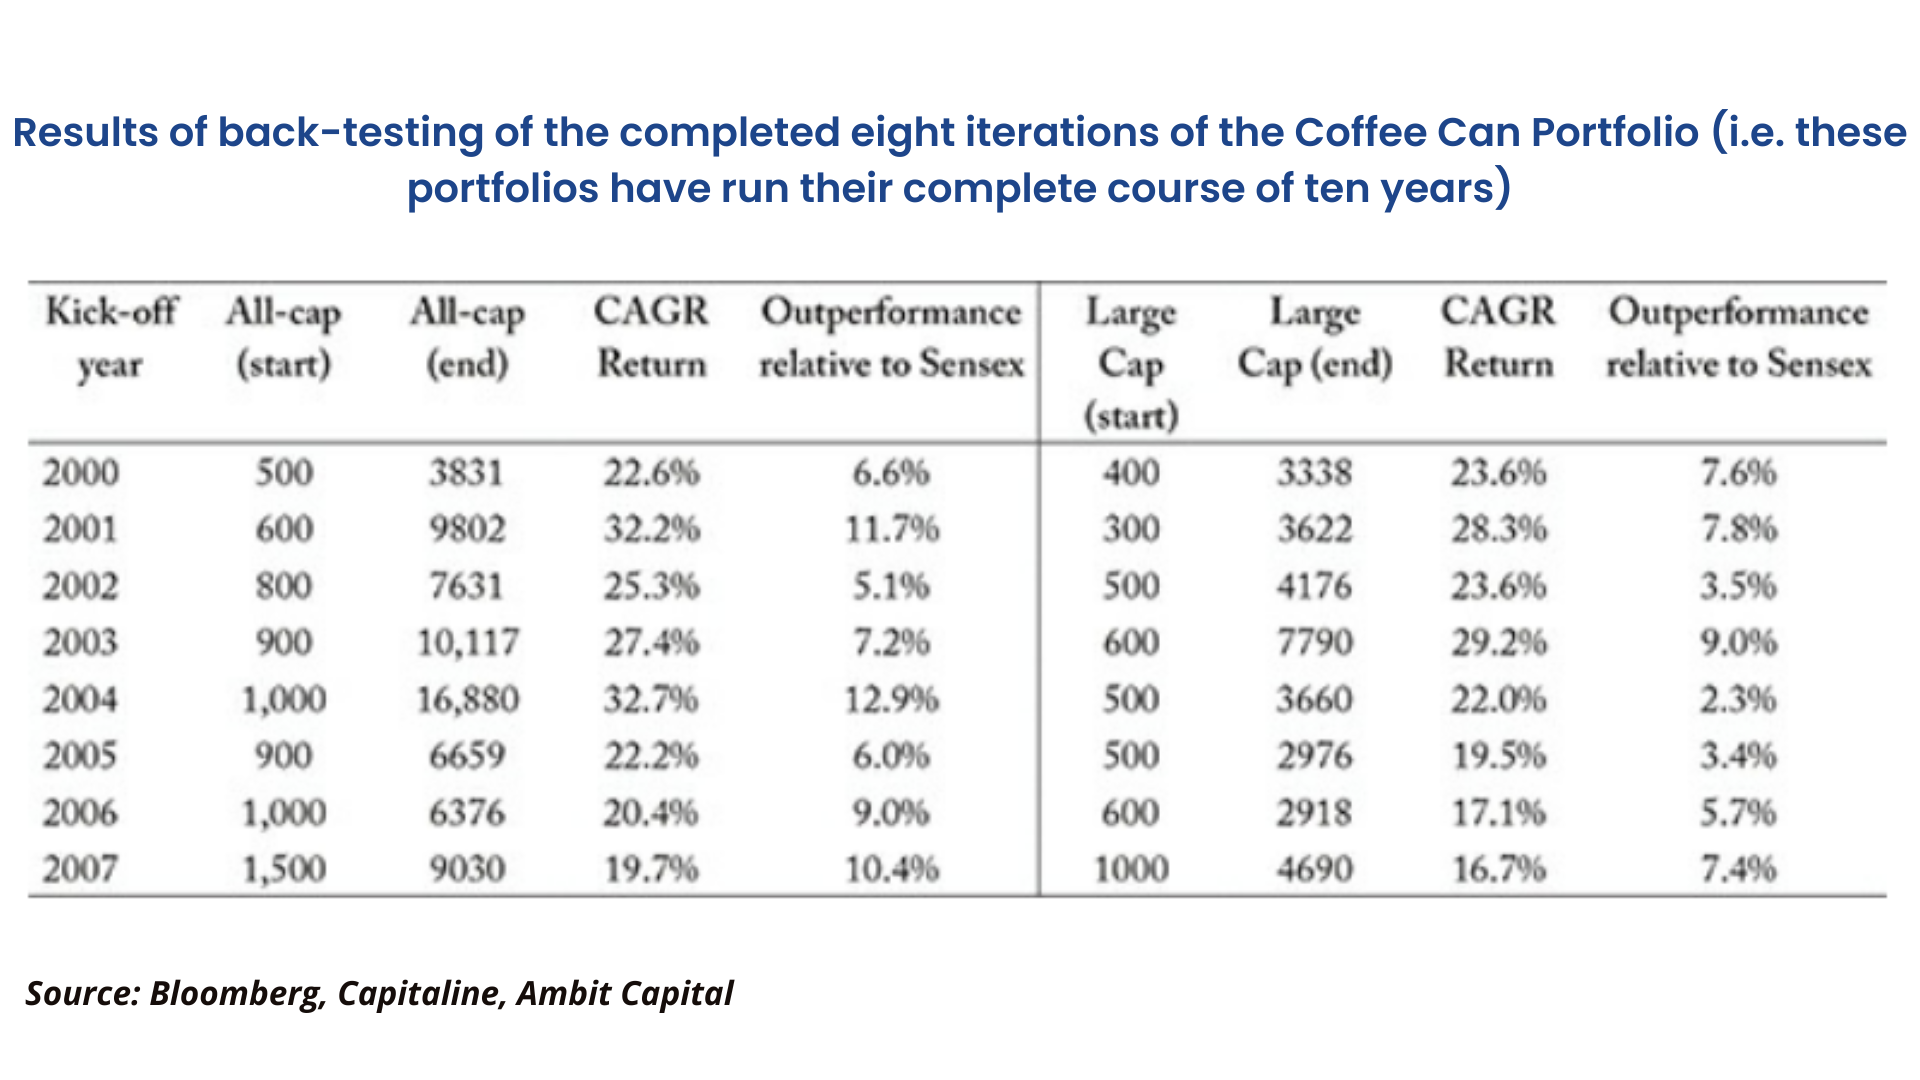
Both in backtesting and in the live portfolios, it was found that this simple approach delivers consistently aggressive results.
This type of portfolio not only outperforms the benchmark consistently, but it also delivers healthy absolute returns, and, more specifically, it performs extremely well when the broader market is experiencing stress.
Steps to construct a Coffee Can Portfolio:
The author limits his search to:
- Companies with a minimum market capitalisation of ₹ 100 crores (from a total of 5000 companies), as the reliability of data on smaller companies, is susceptible. There are around 1500 listed companies in India with a market cap greater than ₹100 crores.
- Look for companies that over the preceding decade have grown sales each year by at least 10%.
- Generated a Return on Capital Employed (ROCE ) - pre-tax of at least 15%.
These 3 criterias should be fulfilled for a stock to be a part of the coffee can portfolio.
1. Why ROCE?
ROCE = EBIT/(Debt and Equity).
It is the metric that measures the efficiency of capital deployment for a company.
2. Why use ROCE of 15%?
It is the bare minimum required to beat the cost of capital.
The risk-free rate of return is typically 8% and an equity risk premium of 6.5 to 7 % brings ROCE to 15%.
The equity risk premium is derived from the US equity market + India's credit risk premium.
3. Why should we use a revenue growth filter of 10% every year?
We should look for companies that deliver revenue growth of 10% every year for 10 consecutive years.
Why 10% revenue growth?
This is because the nominal GDP growth rate has averaged to 13.8% over 10 years + adjustment for inflation.
Very few listed companies fulfill this requirement. So we have kept it to 10% growth every year for 10 consecutive years.
For financial services company:
1.Return on equity (ROE) has to be 15% -
For banks, ROE is a fairer measure than ROA. It shows their ability to generate higher income efficiently on a given equity capital base over time.
2.A loan growth rate of 15% -
Given that nominal GDP growth in India has averaged 13.8% over the past 10 years, loan growth of at least 15% is an indication of a Bank's ability to lend over business cycles.
Strong lenders ride the down cycle better, as competitive advantages surrounding the ability to source lending opportunities, credit appraisal, and collection of outstanding loans ensure that they continue their growth profitably either through market share promised improvements or by upping the Ante in sectors that are resilient during a downturn.
Characteristics Of Coffee Can Portfolio
- A coffee can portfolio, based on data as early from 1991, shows that it beats the benchmark across all time periods. It performs admirably well during stressful periods.
- If invested for over a decade with no churn, this portfolio generates returns that are substantially higher than the benchmark and give a compound annualized outperformance of 11.9% points.
- When we analysed the performance of the 17 historical iterations of the coffee can portfolio with each portfolio lasting for up to 10 years of holding period, there are 125 years of accumulated portfolio investments.
- The median portfolio return (compounded and annualized) has remained robust at around 24 to 25% historically regardless of whether the investor's holding period has been as short as three years or as long as 10 years.
- The coffee can portfolio also delivers an extremely low level of volatility in these annualized returns for all holding periods- a necessary condition for investors to hold large exposure to equities.
- Historical data suggests that the coffee can portfolio offers a probability of more than 95% of generating a positive return, as long as the investors’ holding period is at least 3 years.
If the holding period is for at least 5 years, there is more than a 95% probability of generating a return greater than 9%. A run rate of 26% return per annum results in the portfolio growing in size to 10 times in 10 years, 100 times in 20 years, and 1000 times in 30 years. - When it comes to investing in the stock market, greatness is defined as the 'ability of a company to grow while sustaining its moats over a long period of time'. This enables such great companies to sustain superior financial performance over several decades.
Why Does Coffee Can Portfolio Perform Well?
- The coffee can portfolio is built using twin filters, which are used to identify great companies that have the DNA to sustain their competitive advantages over 10 to 20 years or even longer.
- Greatness is not a temporary phenomenon and definitely not a short-term phenomenon. It does not change from one quarterly result to another. Great companies can endure difficult economic conditions and that's why they also thrive in economic downturns.
- Great companies do not get distracted by evolution in their customer’s preferences or competitors or any operational aspect of their business. Their management has various strategies that can deliver results better than their competitors can.
- Often such companies appear conservative. However, do not confuse conservatism with complacency. They simply bide their time before making the right move.
Why choose revenue growth and ROCE as the financial metrics to measure 'greatness' of a Company?
According to Charlie Munger,
Earnings growth is not an independent metric, instead, it is the outcome of 2 independent metrics:
1. Growth in capital employed, and
2. The Firm’s ability to generate ROCE.
Revenue earnings growth can be achieved either by growing capital employed while maintaining ROCE or by growing ROCE through enhanced operating efficiencies while maintaining the firm's capital employed.
There are 3 categories of businesses based on ROC:
1.High earnings with low Capital requirement:
These businesses can't reinvest a large portion of their earnings internally at high rates of return for a longer period of time.
But in light of firms’ pricing power, earnings keep growing without needing incremental capital. Hence they steadily keep delivering a high rate of capital employed.
Typically for such companies, 2 factors help minimise the funds required for operations:
- The product is sold for cash which eliminates the need to wait for customers to pay up and thus, reduces accounts receivable.
- The production and distribution cycle is short which minimises the inventory.
Such a business eventually becomes a cash machine, allowing investors to use a steady stream of cash to buy other attractive businesses.
Hindustan Unilever is an example of this kind of business.
2.Businesses that require capital to grow and generate a decent ROCE:
Such businesses are extremely difficult to find.
Typically, companies require additional capital to keep growing their earnings because growing businesses have both working capital needs, which increases in proportion to sales growth, and significant requirements for fixed asset investments.
Such businesses are also decent investment options as long as they enjoy durable competitive advantages that can lead to attractive returns on the incremental capital employed.
An example of this type of business is HDFC Bank
HDFC Bank’s outstanding performance:
A.A risk-aware culture that focuses on generating healthy returns without taking risks,
B.An internal architecture that consistently allows the bank to innovate, and rethink the core process flows that characterize the central offering of the banking sector,
C.The strength of the iconic HDFC brand.
3.Businesses that require capital but generate low returns on capital:
This is the worst kind of business that grows rapidly but requires significant capital to engender growth and then earns little or no money.
A very classic example of this kind is the Indian telecom sector.
Such businesses’ demand for capital is insatiable and investors who have chased growth of such companies end up destroying wealth over long periods of time.
Example- Bharti Airtel’s share price in August 2017 was 2% lower than what it was 10 years ago.
Case Study: Page Industries
Page Industries is the parent company of some famous franchises like Jockey and Speedo.
For the past 15 years, this firm has consistently achieved revenue growth in excess of 10% per annum.

This company is a perfect example according to the Warren Buffett categorisation of business. It requires capital to grow and generates decent ROCE. The company reinvested 50% of its operating cash flows into its core business activities via fixed asset investments to expand its manufacturing capacity.
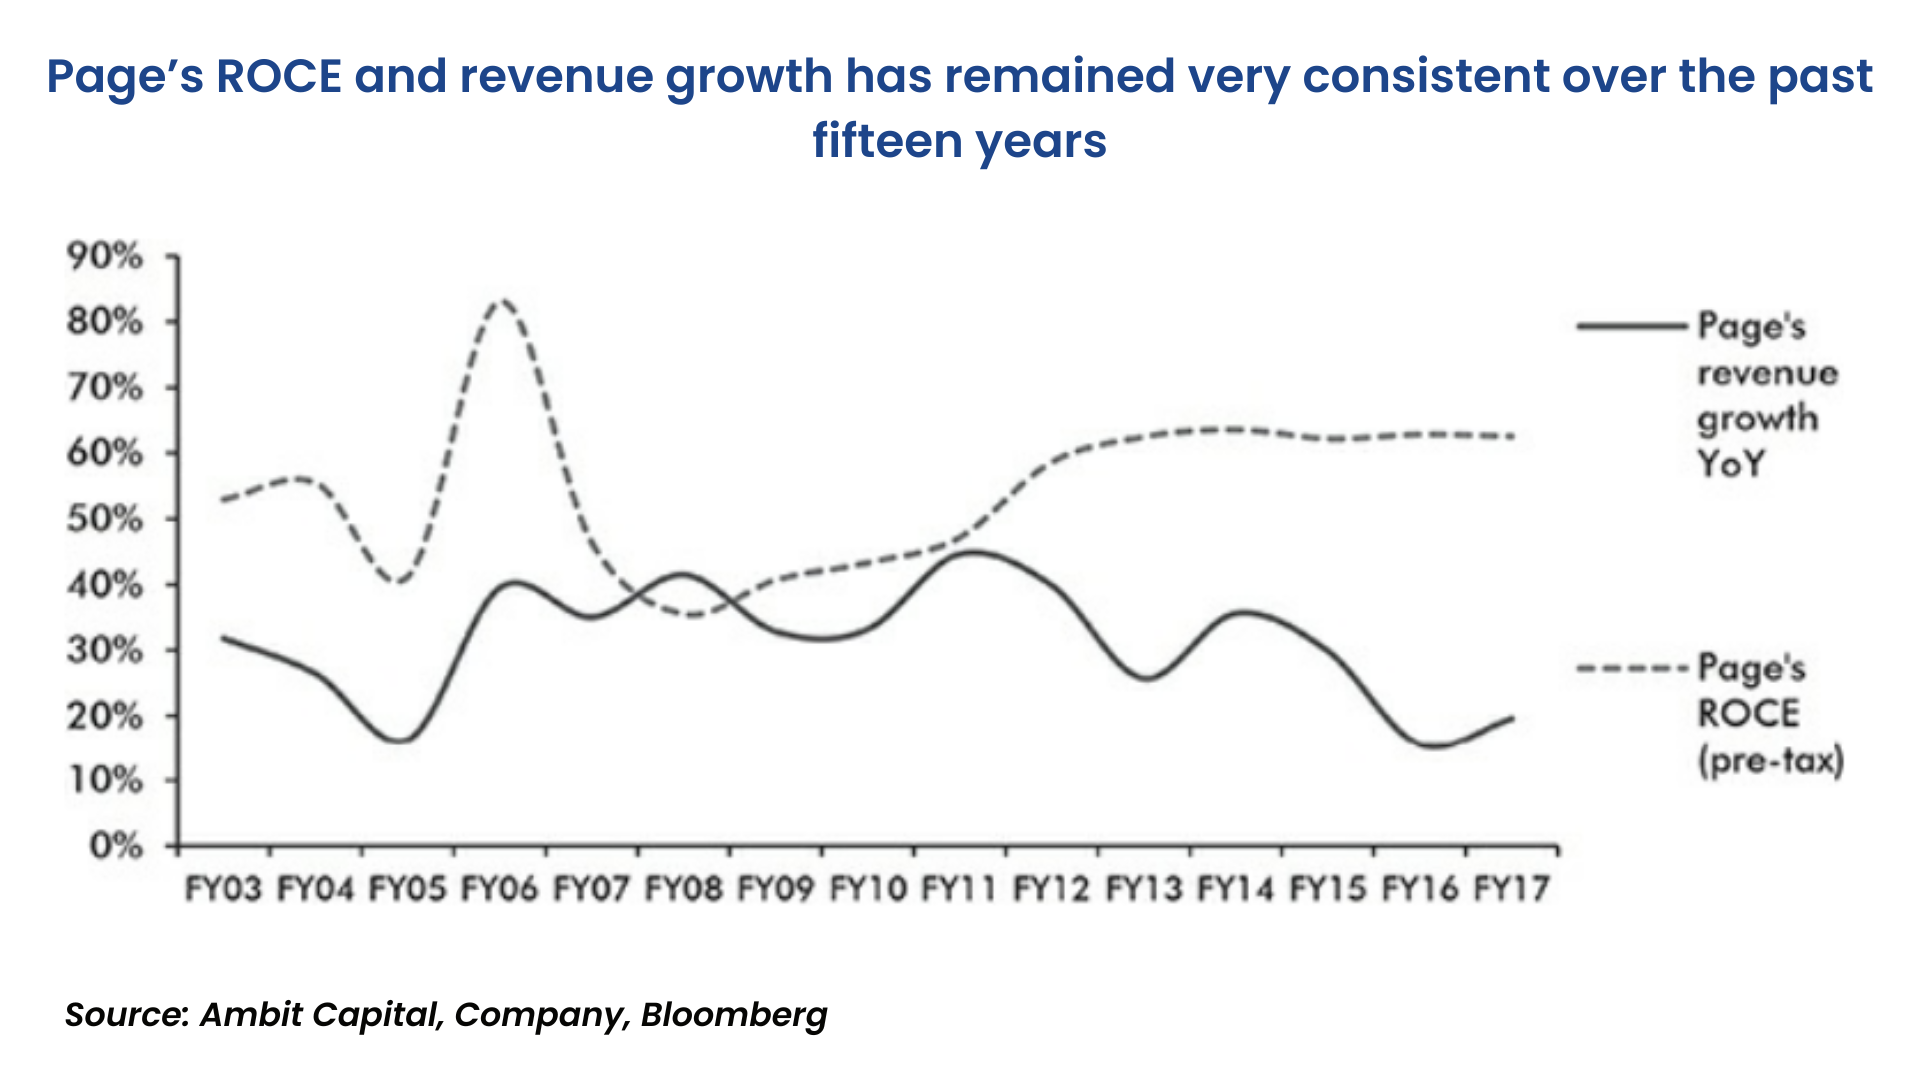
The company has either maintained or improved its ROCE over time, implying that it is successful and consistent in generating healthy ROCE on the reinvested capital too.
Page’s share price has grown at 45% per annum over the past decade. The trailing P/E ratio has gone up from 27 times in 2007 to 70 times in 2017, implying a CAGR of 10% in the P/E multiple.
The firm has delivered a 32% earnings CAGR over this decade.
Conclusion:
80% of Page’s share price can be attributed to its earnings growth and only the remaining balance of 20% to P/E multiple. Its price performance is largely attributed to its healthy earnings trajectory rather than the rating of its P/E multiple.
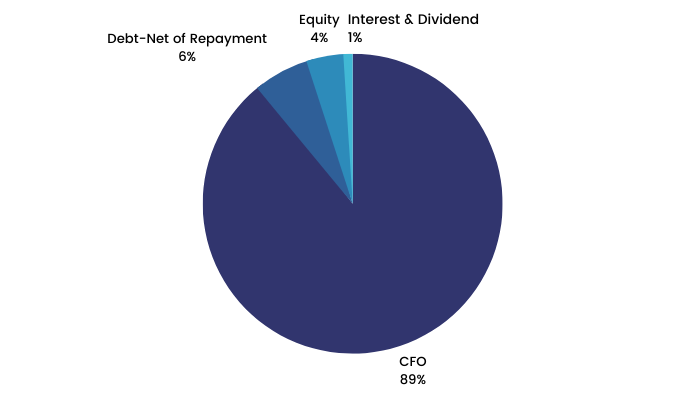
Reasons of success for Page Industries:
1.Focus on keeping its notes by maintaining strict capital allocation discipline:
89% CFO, 6% debt, 4% equity, 1% interest and dividend.
Source of Funds for Page Industries from FY 07-17 (Large Internal Accruals)
2.The manufacturing process of Page is its biggest competitive advantage.
3.Page is in a labor-intensive industry where there is a limited scope for automation. While other company's attrition rate is 100%. Page’s attrition rate is only 12-13%.
It has achieved this through capacity expansion, i.e., not more than 1500 labourers in a single factory, while they also focus on hiring women.
Lifestyle support has been provided to their workforce and they ensure that their workforce is regularly trained. This ensures high-efficiency, productivity across the company. The operational efficiency helps them to produce high-quality products.
4.Innovative marketing, retail and distribution. Advertising has been unique by this company, with high impact campaigns. Consistent use of Caucasian models in its advertisements, projecting it to be an international brand.
5.The biggest franchise is Jockey USA.
6.Increase in size and depth.
Importance Of Long Term Holding
The case against churn:
Apart from the twin filters, one of the main conditions of CCP is to hold on to it for 10 years without churning it.
There are very compelling reasons on why should we not touch our investments:
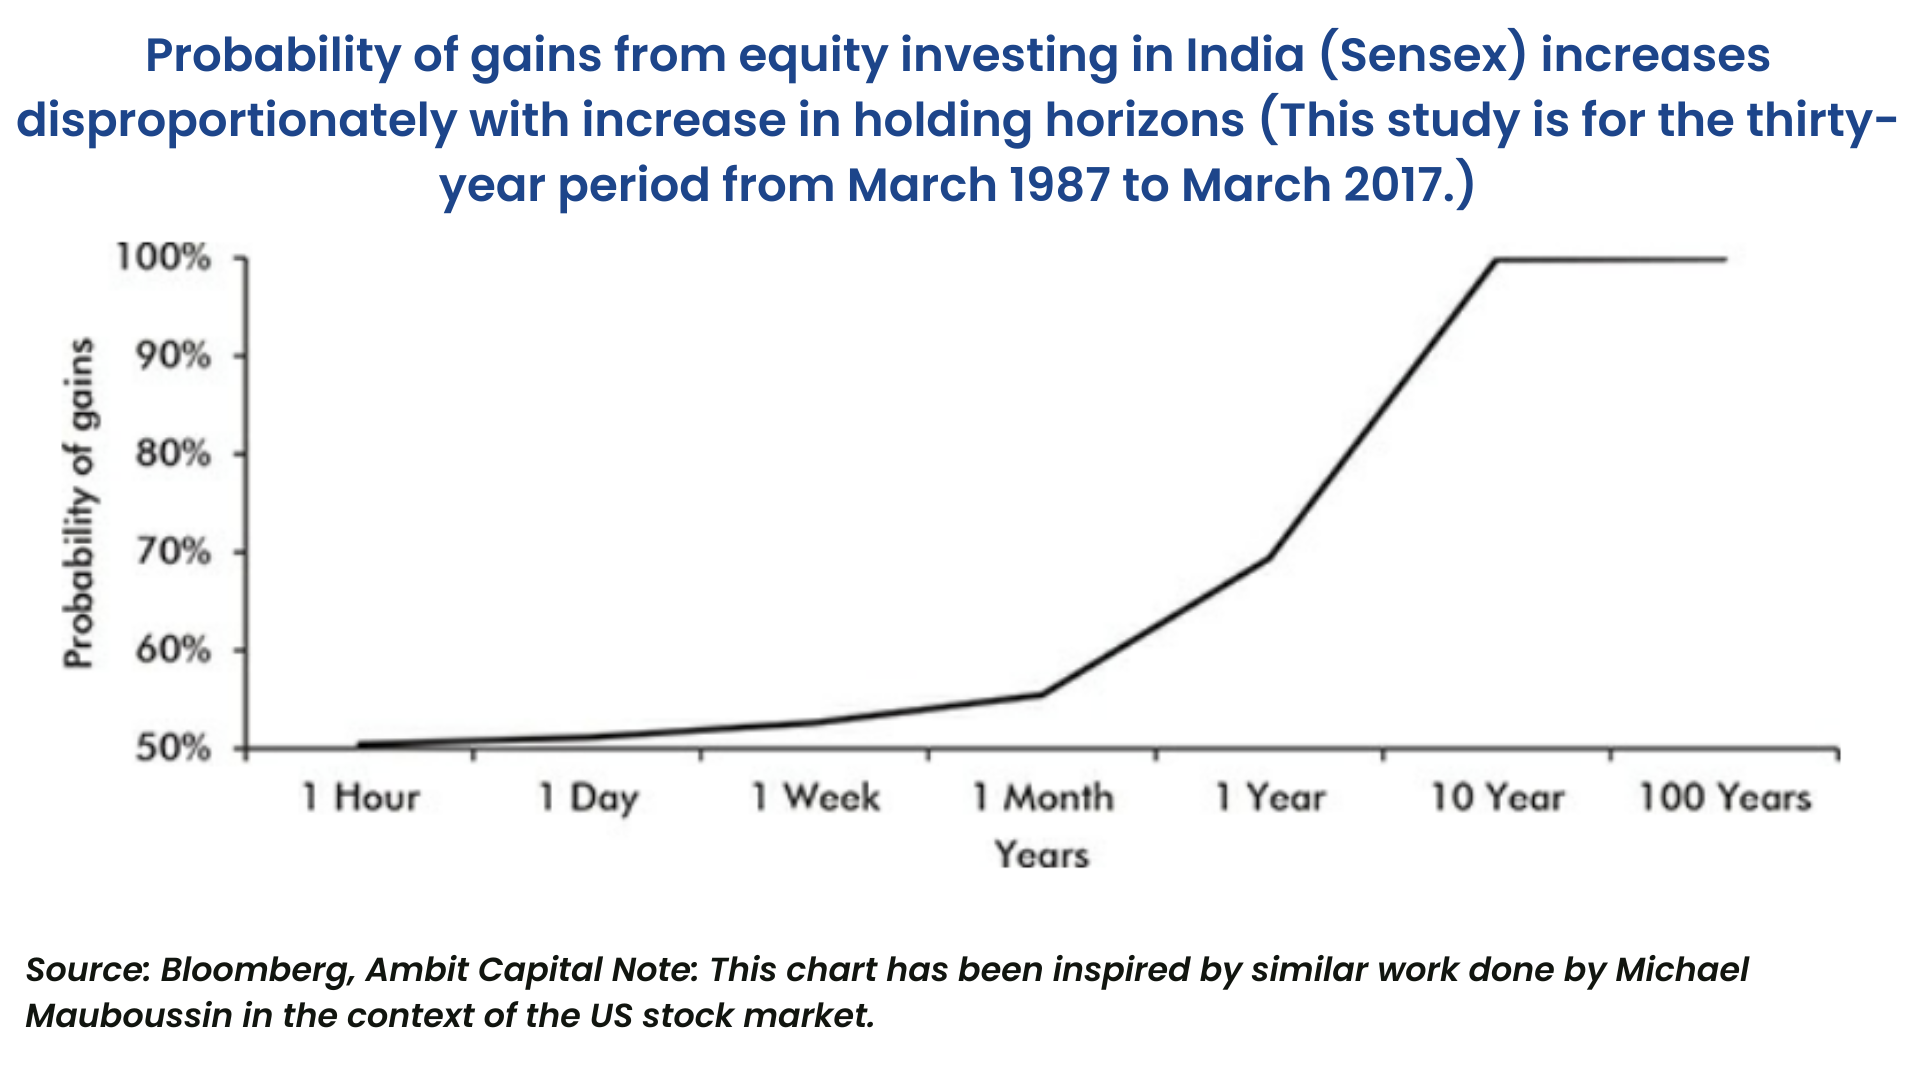
1.Higher probability of profits over longer periods of time:
Equity is an asset class that is prone to extreme movements during short periods.
Over a longer time horizon, the odds of profits are very high.
Sensex over the last 30 years has a CAGR of 14.5%, and its standard deviation is 28.6%.
The probability of generating a positive return in one day works out to be 51.2% while in one year it comes to be around 70%.
10 years or above the probability of generating a positive return is 100%.
2.Power of compounding:
Holding a Portfolio of stock for 10 years allows the power of compounding to play out its magic. Over the longer term, the portfolio will be dominated by the winning stocks, whilst the negative return generating stocks will keep on declining, and become inconsequential.
Thus, the contribution of the winners will outweigh the negative contribution of losers. This will eventually help the portfolio to compound handsomely.
For example, if we invest 50% in Stock A and 50% in Stock B, and if the returns of both the stocks are 26% and -26%, the portfolio return would be 17.6% in a 10-year period. That is strange.
3.Neutralising the negatives of noise:
It is easy to say that we should ignore the noise in a market but, it is quite another thing to master the psychological effects of that noise.
Once you have identified a great franchise and you have the ability to hold onto it for a long period of time, there is no point trying to be too precise about timing for entry or exit. The reason behind this is, as soon as you try to time that entry/exit, you run the risk of noise rather than fundamentals driving your investment decisions.
4.Transaction cost:
By holding a Portfolio of stock for over 10 years, the fund manager resists the temptation to buy/sell in the short-term, which in turn, reduces the transaction cost. This will ultimately add to the overall portfolio performance.
Around 9% of the final Corpus is lost to churn over the 10-year period.
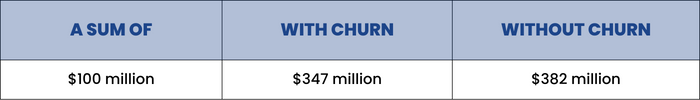
The shortfall in the return is obviously the returns that the broking committee earns for helping the investor churn his/her portfolio.
Value Investing In India
Q. Why are valuations important?
Isn’t buying and selling at the right price the greatest skill in investment?
Q. Given that P/E multiples have expanded for high-quality companies, should an investor be concerned about the sustainability of stock returns if they buy at the current price levels?
“Our answer is a resounding NO”.
- The starting period valuation has very little impact on long/ medium-term investment returns in India.
- Lack of correlation between starting period valuations and long-term holding period return seems to be specific to India.
French Nobel Prize winner in economics and a few professors define the term value premium as “ the outperformance of value stocks over growth stocks when measured using risk-adjusted returns compared to a high P/E multiple stocks.” - Low P/E multiple stocks achieve a high risk-adjusted return compared to High P/E multiple stocks.
- Analysis of the Indian stock market suggests that a low P/E multiple-based investing approach does not improve the return profile of an investor.
Given this analysis of value investing, it's clear that investors in the Indian stock market should stick with high-quality franchises for the long haul without giving undue importance to valuations.
So buying cheap stock is not a very clever idea.
Buy And Hold Vs Valuations
Q. Selling expensive stocks when they become expensive. Is that a good idea?
Let us analyse the buy and hold strategy versus valuation driven selling:
Selling the Coffee Can Portfolio when the Nifty P/E is above 20 does not outperform ‘Buy and Hold’:
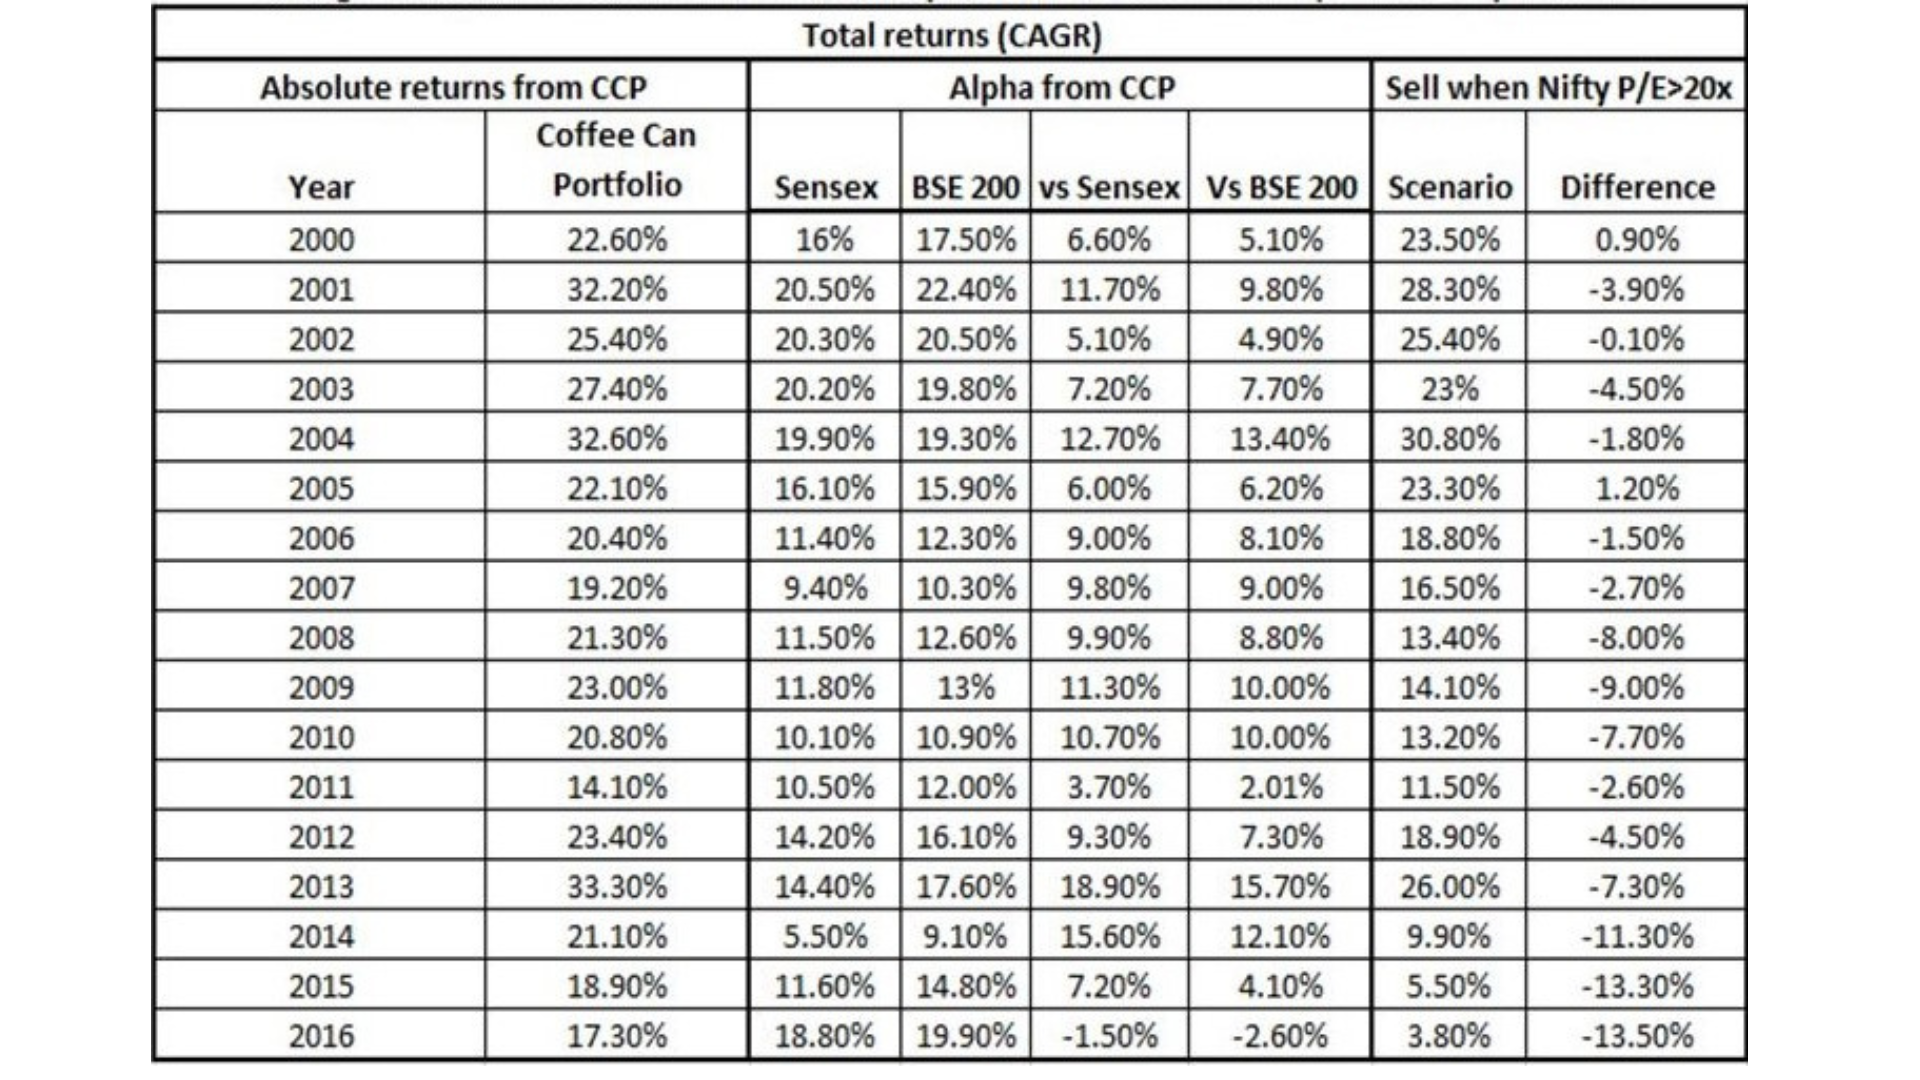
Here, the author and his team sold the stocks when the Nifty’s trailing P/E multiple went above 20 times and invested in government bonds. After this, they waited for a year before making a reinvestment decision. Such a decision is taken only if the P/E multiple drops below 20 times.
Conclusion:
An investment policy that sells the Coffee Can Portfolio when Nifty is trading at above a certain P/E multiple, and buys Coffee Can Portfolio when Nifty is trading below a certain P/E level does not generate any outperformance compared to buy and hold strategy.
The findings above make sense when one realises that the company that does make it to the Coffee Can Portfolio enjoys some sustainable competitive advantages over its competitors and reflects this in the share price performance.
Three Common Characteristics
The Coffee Can Portfolio tends to have three common characteristics:
- Special focus on the core franchises, instead of being distracted by the short-term gambles outside the core segment.
- Relentless deepening of competitive moats.
- Sensible capital allocation.
Trying to time the market patience using valuations as a guide can prove to be counterproductive.
Companies which possess these three characteristics mentioned above are not only very rare in India, they continue to outperform 99.5% of the listed companies year after year based on fundamentals.
Coffee Can Portfolio is skewed towards specific themes by design due to the desire for longevity and consistency of performance.
1.More Business To Customer business than Business To Business sectors: Eg. Banking, Pharma, etc.
Coffee Can Portfolio has small ticket size and repeat purchase of products and services like residential real estatebased on consumer loyalty and frequent consumer interaction due to proximity. Hence, consumers can recognise the trends better.
2.Structural and Cyclical Plays:
The author here wants to say that we as common investors shouldn't invest in cyclical stocks because economic cycles are unpredictable.
Moreover, a long-term investor who wants to successfully invest in structural stocks should follow the bottom-up analysis, i.e., first analyse a stock, then its sector and after that the economy.
3.Avoid companies that borrow lots of money to grow:
Leverage is good if it can improve capital efficiency or if it is for an increase in capital expenditure. Companies like Power, Steel, Real Estate offices, etc, need leverage to grow their revenue. This makes it difficult to sell their assets at a time of necessity. Changes in credit supply can affect their ROCE.
A large part of the bandwidth goes in servicing the debt in their balance sheet
4.Prefer companies with intangible strategic assets such as intangible assets:
This can include intellectual property patents or property know-how licences or culture-oriented aspects like hiring technological backbone and proactively looking after company's channel partners, vendors and employees.
Expenses Matter
At 1% or more brokerage per transaction and due to frequent churn, Mr. Talwar ended up paying almost 7% per annum of the stock portfolio as commissions.
In ULIPs, Mr. Talwar ended up paying 60% of his first year premium as fees. Such a high fee significantly reduces the principal left for actual investments. This is like starting a run chase in a one-day cricket match with 4 wickets down. Obviously, the impact is huge because of the complexity of this multi-decadal product.
There are three types of expenses which we should consider:
1.Transaction brokerage fees paid every time there is a transaction that adds up to a big amount. It becomes bigger when frequent trading takes place. It comes to approx. 5% of the portfolio amount.
2.Annual fees are applicable typically in mutual funds and PMS fund managers. They charge annual fees for their service and alongside managers are also entitled to profit sharing.
3. Hidden fees are there in insurance and structured products. Investors are unable to figure out these charges easily. Investors could simply calculate the return on its principal, which would be the net returns he would get.
Expenses have been a blind spot for investors who have unfortunately focused on gross returns. Brokers and intermediaries have created different ways to skim investors.
Fund expenses compounds too!
Comparing two portfolios both with 15 % return and expense ratio 2.5 per cent and 0.01% per annum. ₹1,00,000 invested in both the portfolios after 40 years will be ₹ 1.11 crore in portfolio A and ₹2.5 crore in portfolio B
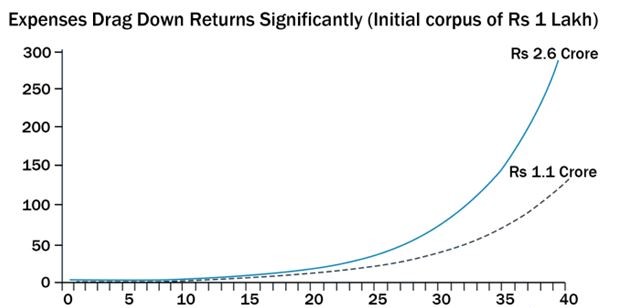
Presently, most equity Mutual Funds have an annual management fees of 2.5 % . In an ETF, the fee is approximately 0.1%.
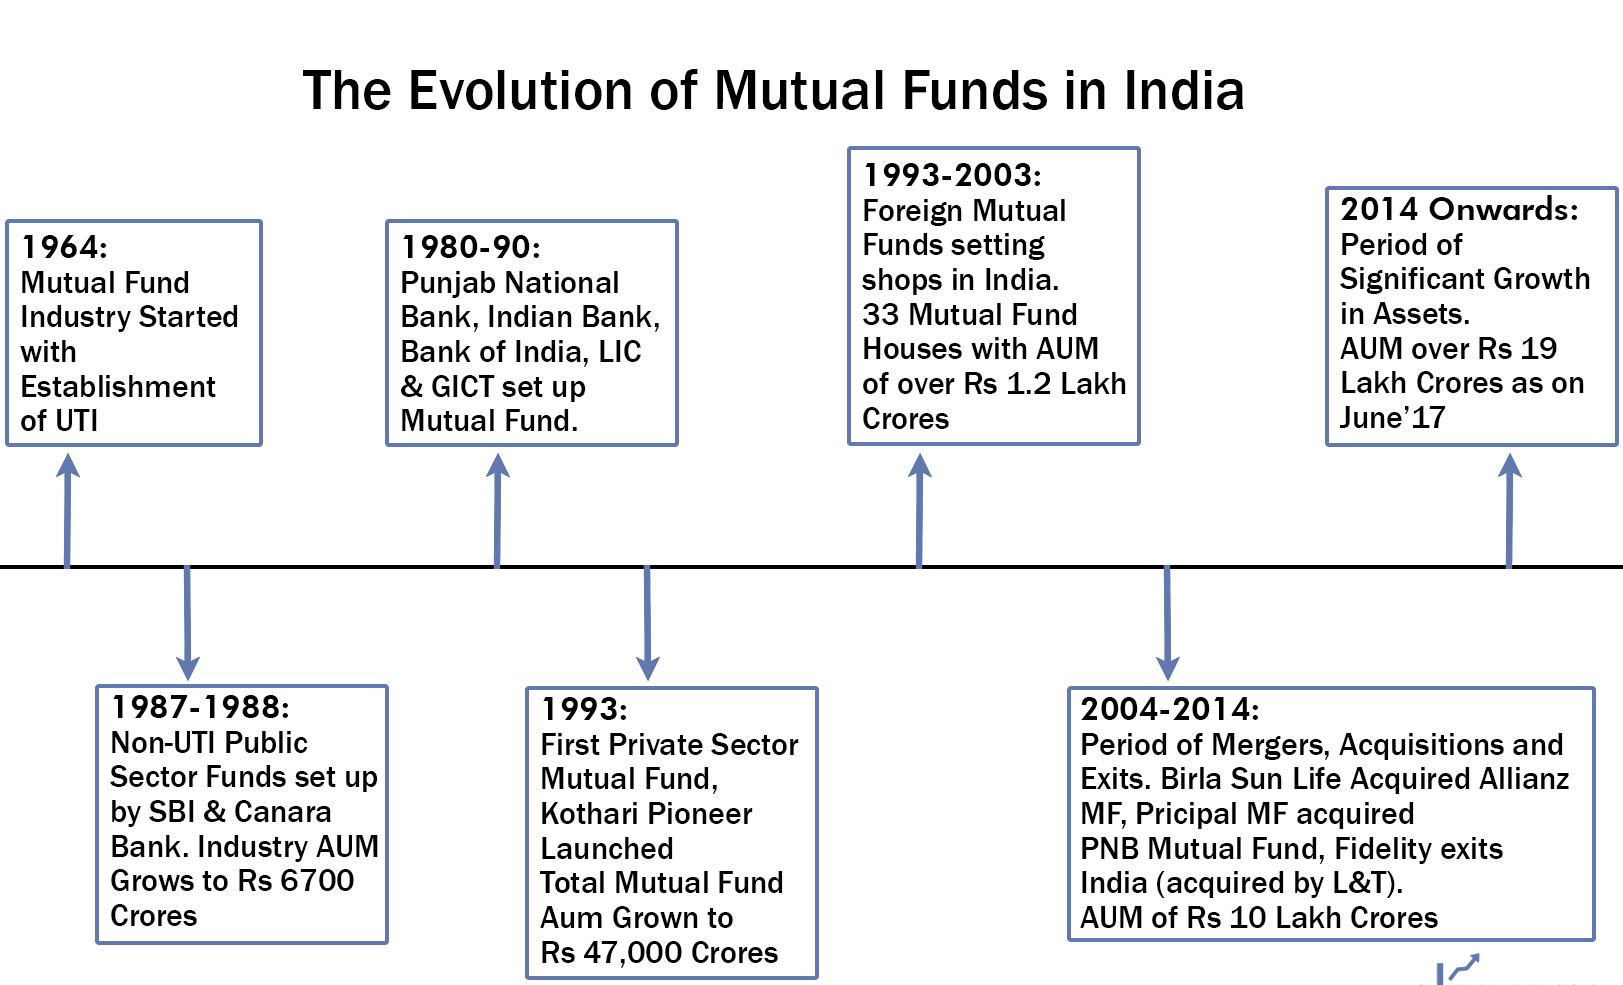
Past, present and future
Mutual fund industry started in 1963 when UTI was formed. Initially, all fund managers outperformed the index. However, with the rising competition and greater regulatory oversight, it has become much more difficult for managers to outperform the index and this in turn, squeezes profit margins for the mutual funds. NAV Mutual Funds have brought modern technology to the forefront and enterprising fund houses have started using algorithms to run funds at a very low cost.
Why have expenses remained high in India?
Fund managers were able to generate extremely handsome returns due to the Bull market run of the Indian stock market, hence the clients could afford the high expenses. Distributor brokers sell mutual fund schemes to the Indian investor and get commissions from fund houses in return.They also charge annual fees and upfront fees. The biggest distributors are banks -both Indian banks and MNCs.
Over time, a second category of mutual funds with lower expenses have emerged called passive funds.
Active Versus Passive Funds
In the Mutual Funds industry, Alpha is the incremental performance that the fund manager generates vis-a-vis the benchmark such as Nifty and Sensex.
ETFs as a rule have minimal expense ratios since they do not offer active fund management. It's like a technology platform. Since it does not have to pay a fund manager it is able to charge fees which are lower than actively managed funds.
Most Index ETFs today charge fees ranging from 0.05 to 0.15% whereas most active equity funds in India charge in excess of 2%.
In an imperfect and developing stock market like India, there is still information asymmetry. It is reducing gradually as SEBI ramps up its vigilance, the outperformance of active funds is under stake.
According to Pawan Agarwal, the nexus of brokers had its good days in the late 1900’s and early 2000s. Money was being made and lost by rigging up prices all the way up and then down. While brokers, in cahoots with the promoters, were making a lot of money, innocent investors were burning their hands. The shady practices are one of the reasons why stock market investment never took off among Indian retail investors.
Alpha Squeeze in Indian mutual funds
The Americans were the first to fall in love with passive funds. Convinced about Alpha squeeze and low expense ratios, active funds in the US in 2016 saw a net outflow of $326 billion compared to passive funds. The passive funds reported a net inflow of $429 billion.
Developments in India
SEBI has capped the expense ratios of equity mutual funds to 2% per annum and debt MF to 2.25 % per annum. It abolished entry loads, which means no upfront fees from clients. It also reduced distributors' incentives to a large extent.
When the fund houses started paying distributors an up-front commission, then SEBI, through AMFI, introduced guidelines stating that the upfront commission that a fund pays a distributor cannot be more than 1%.
The guidelines also placed restrictions on trail commissions and mandated that for subsequent years, it should not be higher than that of the first year.
Direct schemes: SEBI’s knockout punch
- In 2007, SEBI launched direct schemes.
- Least possible expense. No Commission to brokers.
- It gives investors an option to deal directly with any fund house without any intermediaries.
- The process to buy the schemes remains the same except that the investor keeps the broker code field empty in the mutual fund application form.
- In 2013 SEBI mandated that all Mutual Funds had to have a direct option for all schemes
- The fees came down to almost half the expenses charged by conventional Mutual Funds due to disintermediation of the brokers.
Result:
- 38% of Industry Assets are under direct schemes.
- In Debt funds, 61% AUM is under direct schemes.
- In equity funds, 13 % AUM is under direct schemes.
- These numbers will keep rising as this trend is irreversible.
- In 2013, regulators announced that an intermediary can only be an advisor or a distributor and not both. A distributor cannot recommend a fund.
- According to the new regulatory construct, an advisor cannot earn anything from the schemes he is recommending. He earns only an advisory fee of 0.1 % and 1% of acid advice directly from the client which is the part of the contract between him and the client.
This contract and fee construct now aligns the investors' interest with that of the advisor because the client now invests in direct schemes and the distributor does not get any commission from the product he is recommending.
The Real Estate Trap
Real estate remains the biggest asset by value in most Indian portfolios. Though it is perceived as the safest asset class, that's not true. Until the mid 1900’s owning a house was restricted to very few families. However by 2003-13, the scenarios changed. Due to the rise of this asset affordability and interest rates coming down significantly, real estate became the flavour of the season. An increase in loan by value from 65 % to 95%, increase in household income and tax incentives from the government were all the factors that contributed to make houses affordable for the middle class.
But despite all positive publicity given to this asset class, and despite of how some people have made fortunes by real estate investments, This asset class is uniquely dangerous for the following reasons:
1. Investment size- To enter into real estate, one needs a huge corpus unlike stocks or mutual funds. This makes real estate a rich man's asset class. High ticket size prevents widespread adoption of this class.
2. Real estate is a highly illiquid asset class- Finding a buyer can be very difficult at times, sometimes almost impossible.
3. High Expenses- Transaction costs, stamp duty, registration and other charges associated with buying property now exceed 10% of the cost of the property. These costs make residential real estate the most expensive asset class to trade by a long margin.
Short term capital gains is at the marginal rate but long term capital gains are 20%. This implies that most of the gain from investment in real estate is lost via transaction and taxation.
4. Non-standardardised asset- Real estate is a very non-standard asset. It varies across macro markets (Mumbai Vs Delhi) and micro markets (Bandra Vs Lower Parel). It is a very unpredictable asset class and returns are driven by luck as by thought out investment decisions.
5. A murky sector- Residential real estates are marked within requirement of regulatory clearances. Many real estate developers have realised they might as well work in partnership with politicians,regulators and civil servants. It is these people who are the first in the queue to cream the gains from real estate investments. The middle class, no matter how affluent, is the last to benefit from any upside associated with real estate development in India.
Why do so many investors get trapped in residential real estate?
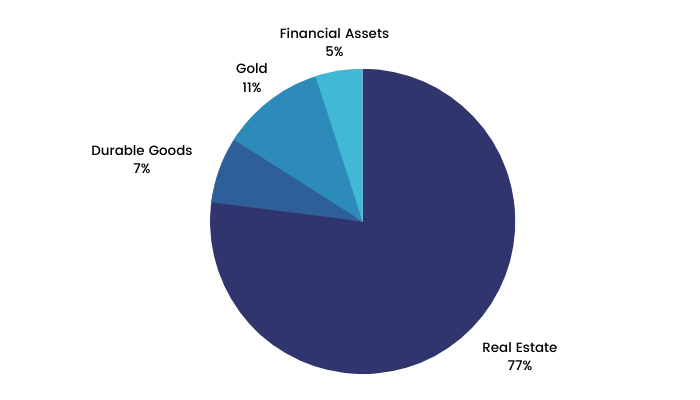
1.A Head start: Gold and land were the most familiar asset classes amongst people. Stock markets came in much later. Only 5% is invested in financial assets against 77% in real estate.
The allocation of household assets in India shows significant skew towards Real Estate. Take a look at the pie-chart below:
2.One way trend-prices going up: Real estate runs into super cycles of more than 10 years. So most people who made significant progress in the Bull cycle of 2003-13 don't have any experiences or memory of a downward cycle.
3.The lure of magnificent returns: This asset class made a tremendous amount of money over 2013 as prices went up by 5 to 10 times. For most buyers, the return on the amount invested is mind-boggling. However, as we learn subsequently, 2003-13 was the best period of real estate in India. It'll be long before we see another such period of price appreciation. In fact in this illiquid and tax-unfriendly asset class, investors can really get squeezed on their mortgages as their modest equity is wiped out by drop in the price of property.
4.Absolute Returns vs Compounded Returns: Most real estate investors are usually satisfied simply because they look at absolute returns in isolation. Thus, investors also invest in real estate because most of them burnt their fingers in stock markets. Investors don't realise that property prices go up 5 times in the last 20 years, but the compound annualized return the property has generated for the last 20 years is just 8.3%. In the same period, the stock market benchmark index is likely to have risen at 15% per annum which compound over 20 years translates to a 16 X return!
5.Coffee Can in real estate: Investors also invest in real estate because most of them burn their fingers in stocks. The reason behind this is, the inadvertent coffee can style of investing they adopt in real estate as against the trading style in their stock portfolios. When it comes to real estate, investors are happy to buy and hold for long periods of time. As a result, they end up holding the properties through thick and thin which is why they are able to see an appreciation in the value.
Busting the myth: Real estate as an asset class is safe as a house.
a.Lesson from the world: Since 1900, real estate in the US has given an annual compounded return of 0.4 % as against an annual return of 5% from the DOW JONES. The same story is applicable for Germany where the return is 2%. In Japan real estate goes through a boom-bust cycle but since the cycles are long, investors tend to forget the previous bust.
b.In India most residential real estate is unaffordable: Indian property is easily among the most expensive in the world. Price per square meter as a multiple of GDP per capita India. It is the most expensive residential real estate in the world by a gigantic margin. In the absence of GDP growth, residential real estate prices in India have nowhere to go but down. Rental Yields/ Price of property is lowest in the world at 2.4%. Most developed countries' rental is far higher than their 10 year government Bond rates. In India, it is the reverse. The 10 year Bond rate is 6.7 % and rental yield is just 2.4 %.
By any yardstick, residential property in India is significantly overvalued.
Portfolio allocation: Does it make sense to invest in real estate?
Does real estate deserve a place in your portfolio?
In isolation, the answer is an emphatic NO. Even in terms of diversification this asset class is not worth investing.
Diversification only works if the Asset classes are less than perfectly correlated with each other. If both asset classes behave in a very similar manner, the diversification of risk simply does not happen.
The long term correlation between Dow Jones and US property was 78% implying that American stock market and American real estate prices move in sync.
Investors will have to throw their preconceived notions regarding real estate out of the window if they want to have any hope of generating healthy post tax returns.
Small Is Beautiful
Stock market scenario in 1990’s
- Multibagger stocks to the extent of 30X.
- People enjoyed the fruits of liberalization.
- Only 6 pages offer documents against 500 pages now.
- Almost all issues aimed at retail investors Vs 50% reserved today for QIB.
Scandals of the early 1990’s prompted SEBI to initiate a cleanup of stock market practices. The most critical of these measures was the dematerialisation of shares. This development curbed a range of malpractices which hinged on duping investors with forged share certificates. Unfortunately, these positive regulatory changes had a massive adverse impact on retail inflows into the stock market over the next 20 years. For two decades after this momentous change, Indian investors routed their black money savings away from the stock markets towards real estate and gold.
Rental yields in India's residential property market are now among the lowest in Asia, pointing to significant overvaluation.
Retail investors return to stock market
There has been a trend reversal in investors’ choice of asset classes since 2015, the year in which the NDA launched its multi-pronged attack on black money.
Steps taken by NDA to reduce black money:
- Moving India’s subsidy and benefits system to Direct Benefit Transfer i.e., the direct transfer of 4% of GDP from government bank accounts to recipient bank accounts and thus, significantly reducing the amount of black money stolen by civil servants and politicians.
- Demonetisation of 86% of the country's total currency in circulation. This resulted in the forced deposit of over ₹15 lakh crore into the banking system of which a sizable proportion is likely to have been black money.
- The Real Estate Regulatory Act (RERA)- RERA imposes a range of rules and obligations on the builders, aimed at increasing transparency and accountability. For example, Developers have to put 70% of the funds collected from buyers in a separate account to meet the construction cost of a project.
- Goods and services tax (GST)- This increased tax compliance across the country. In the post GST world, the buyer of any goods/services pays GST at the point of purchase and then gets input tax credit when he reports his expenses. In such a world, if any buyer does not support his purchases,he fails to get the input tax credit and therefore, ends up with a higher effective tax burden.
Left with no better choices, affluent investors are rediscovering the delights of the stock market. The annual run-rate of gross inflows from retail investors in India has risen from ₹48,154 crore (US$ 7.5bn) in FY14 to ₹2.5 lakh crore (US$ 39bn) in FY17, an annualized growth rate of 73 per cent. More generally, net inflows from retail investors to all types of mutual funds have risen from ₹54,083 crore (US$ 8.5bn) in FY14 to ₹3.4 lakh crore (US$ 53.7bn) in FY17, an annualized growth rate of 85 per cent.
The active diversion of savings from the physical form towards the financial form has increased the corpus of bank deposits, bonds outstanding and market cap of the market.
Small Caps Outperform Large Caps
Why do small cap companies outperform large cap companies?
Small companies grow faster
Fundamentally, smaller companies’ profits grow faster than large caps, particularly in periods when credit availability is plentiful, economic growth is accelerating and there are ample undervalued competitors that can be acquired.
When M&A take place at reasonable valuations with the aim of taking synergy benefits, they are share price accretive. High valuations and forays into totally different business lines destroys value. Conversely, small caps tend to underperform when these conditions are reversed.
Small caps outperformance on fundamentals can also be supported by the presence of complacent large-cap incumbents in an industry undergoing disruption or ecological changes which redefine the framework of competitive advantages for that industry.
85% of BSE 500 companies slide towards mediocrity within five years of achieving greatness. In fact, the average probability of a great company actually becoming a sector laggard 5 years later is 25%.
Owners and managers of small companies are hungry to grow, hungry to achieve greatness and all the other perks which come with it. They tend to be intensely driven and do not have to go through layers of management hierarchy in order to respond to changes in the business environment.
Small-Cap companies get discovered
Small cap companies are neglected by the brokerage houses. Besides coverage by brokerage and analysts, policies around liquidity or size may prevent institutional investors from allocating money to small cap stocks.
Brokerages cannot generate enough revenues from institutional trading commissions on small caps. Lack of such potential revenues diminishes the incentive to provide broad research coverage for small caps creating a lower level of market efficiency.
The drop in the cost of capital helps the small caps disproportionately
Cost of capital in India is higher than that of most emerging markets. Secondly, for smaller businesses, the cost of capital is higher than the Indian norm. Regardless, they borrow from banks or from the bond market. The development of the corporate bond market is also likely to lower the cost of funding especially for smaller companies.
As the bond market deepens, higher quality smaller companies will increasingly be able to get cheap credit from the bond market than from the banks.
Investors need professional help in identifying high quality small caps
Scope of generating superior long term investment returns is greater with small caps. The need for professional help is also greater. The reason behind it is small companies are riskier than the large ones due to both fundamental as well as non-fundamental reasons. The good news is that the Indian fund Management Community now offers several high quality small cap and Mid Cap funds.
On the fundamental size, smaller companies often stumble in trying to become big. Significant investments in IT systems and processes across functions-such as HR, Information Technology, Data Analytics, supply chain, manufacturing and advertising-are often not needed to run a small company. However, the lack of proactive investments in such systems and processes make it harder for these firms to scale up without running into logistical or financial issues.
The lack of a high quality professional management means that as and when problems arise, many smaller companies often do not have the management bandwidth to deal with them.
Example: TTK Prestige
TTK Prestige, between 1999-2003, went from a position of strength to the brink of bankruptcy. This downfall was due to a combination of labour issues in its manufacturing plant in Bangalore, a recessionary environment in India, stiff competition in its export markets (US), increase in excise duty on pressure cookers from 8 per cent to 16 per cent and the failed launch of a new product leading to inventory write-offs.
Recollecting this troublesome period, K. Shankaran, Director at TTK Prestige, said in May 2013, ‘The biggest issue we faced was that although we had grown to a decent size, we were still running TTK Prestige as a small company. There was no segregation of responsibilities amongst senior managers and hence, every senior manager was working like a jack of all trades. We had to change that.’
Additionally, TTK had accounting issues, and it is generally seen that smaller companies when compared to larger companies have more accounting issues.
Larger capitalisation firms have better accounting scores on average.
“As a result, whilst the scope for generating superior long-term investment returns is significantly greater with small-caps (relative to large-caps), the need for professional help is disproportionately greater than is the case with large-caps.”
Whilst BSE 100 has compounded at 16.7% per annum over the past eight years, BSE small cap index has compound at 21.4 % per annum over the same period.
How Patience And Quality Intervene?
Let us introduce a term called the ‘patience premium’. This is the difference between annualized returns generated by a stock or an index over any holding period compared to the return generated by the same stock or index over a one-year holding period.
A positive value of ‘patience premium’ implies that the longer the holding period of a stock, the higher is the return generated from it for an investor.
For example, if holding stocks for five years gives you 10% annualized returns whereas holding stocks for one year gives you 7% returns, then, the patience premium is 3%.
Adding Quality premium over Patience premium.
Quality premium is the difference between the annualized returns generated by a stock or a Portfolio and the benchmark index over a particular holding period.
Positive value of the quality premium implies that increasing the quality of the stock portfolio generates better returns for the same investment horizon.
For example, If a person's portfolio generates a return of 17% and Sensex generates 13% during the same tenure period, the Quality Premium for the person's portfolio is 4%.
The probability of generating positive returns increases with the holding period of BSE sensex.
Government Bonds with 8% annualized returns are less risky than a stock with the same returns over 10 years as it is less volatile.
Standard deviation (the measurement of volatility) shows that risk involved in a 1-year holding period is 3 to 4 times higher than the 5-year bonds .
BSE Sensex’s one year investment horizon is the riskiest with risk levels being 6 times higher than that of the 10 Year horizon.
The Risk Vs Return trade off for the Sensex improves as the holding period rises.
The best way to grow one’s wealth, therefore, is to have high returns with low risk i.e., equity investment for a long holding period.
Observation 1: The shorter the holding period the higher is the quality premium
Author has compared the coffee can portfolio as Rahul Dravid and Sensex to Virender Sehwag. He has made an interesting comparison between the batting averages of two cricket legends. Dravid was a great defensive batsman with an effortless batting style which lacked flamboyance—characteristics that sound perfect for the test match format. Sehwag, on the other hand, was an aggressive batsman, ready to flirt with unimaginable risks and looking to hit almost every ball over the boundary. The perfect kind of game required for T-20 matches.

When it comes to the stock market, intuition suggests that shorter investment horizons are akin to speculator investing where investors do not need to focus too much on the quality of the company to generate good returns.
Over longer term horizons one would intuitively imagine investors would need to rely on high quality companies for superior returns.
However our research shows that while the quality premium exists across all holding periods, for the Coffee Can Portfolio - the quantum of the quality premium is higher for shorter holding periods (3-5 yrs) compared to longer holding periods (7-10 yrs).
Hence, the extent of outperformance that an investor can generate by upgrading the quality of his portfolio is greater for shorter holding periods compared to longer holding periods.
Observation 2: High quality portfolios with a very long holding period deliver the highest return with the lowest risk.
Coffee can portfolios have a better risk-return trade off than the Sensex over all investment horizons.
An investor who is able to combine patience with high-quality portfolio construction thus, pulls off the holy grail of investing—outstanding returns with low levels of volatility. That is the essence of the Coffee Can Portfolio.
The three key takeaways from this chapter:
- Patience premium in equity investing: Given the behavioural concept of ‘Myopic loss aversion’ defined by Shlomo Benartzi and Richard Thaler, investors who do not have even a year of patience, i.e. stock holding periods less than one year, are likely to believe that ‘more often than not, people lose money in equity markets’.
- Quality premium in equity investing is higher for shorter time periods
- Combining quality premium with patience premium: Whilst both the Sensex and the Coffee Can Portfolio (CCP) produce better returns (alongside lower volatility) if held longer, the CCP beats the Sensex by a wide margin when it comes to producing superior returns (with its volatility being even lower than that of the Sensex).
Putting It All Together
Essentially, what this book has highlighted is: Investing for long periods of time in high-quality portfolios . . . . . . with a higher weightage to high-quality small-cap companies . . . . . . while ensuring that you don’t pay too much by way of fees . . . . . . and avoiding investment traps like real estate and gold . . . . . . should lead to significant and sustainable wealth creation.
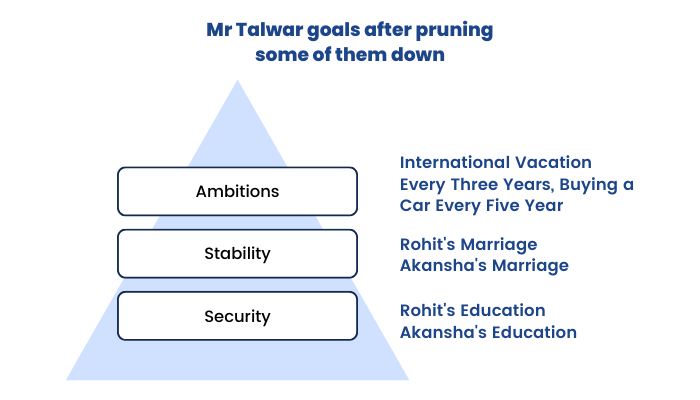
Our goals can be bucketed into three categories:
Security - These goals are extremely important to us and provide protection from anxiety.
Stability - These goals are not as important as the security-related goals, however, they ensure that we maintain a desired standard of living.
Ambitions - These goals will not be necessities but they help us achieve upward wealth mobility and give us a certain status in our social circle.

Mr. Talwar's required rate of return keeping all his goals in mind is a staggering 21% (keeping in mind the time value of money and inflation).
The ‘asking run rate’ of 21 per cent for Mr. Talwar seems steep, especially compared to the kind of returns he has generated in the past. There was no way he could hope to achieve a 21 per cent per annum return every year. This meant Mr. Talwar would have to amend his ‘ambitious’ goals. Ultimately, he lets go of his objective to buy a holiday home and reduces the frequency of overseas vacations and purchase of a new car to three and five years respectively. With these changes, Mr. Talwar’s required rate of return drops to a more achievable number of 16% per annum.
To achieve 16% annual returns the following allocation is suggested.
Equity - 80% - 18.8 % per annum, pre-tax returns
Debt - 20% - 8% per annum
Then, return is equal to 80%*18.8 + 20%*8 = 16.6%
Equity allocation
We divide the equity portfolio to 3 buckets: large cap, midcap and smallcap.
Large cap portfolios
Any company with a market cap of ₹20,000 crores is a large cap company.
Large-cap stocks are the anchor for any investment portfolio as these are time-tested companies with a long and consistent track record of generating returns for shareholders.
Robustness of these companies ensure that share prices are less vulnerable in case of sharp market pullback. This in turn, helps reduce the volatility in the overall value of the portfolio.
For investment in large cap stocks , it's advisable to use an Exchange traded fund (ETF). Outperformance of large cap Mutual Funds has more or less vanished over the last decade. ETFs have therefore become the best way to invest in large cap stocks. These ETFs typically have an annual expense ratio of 0.2 % compared to 2- 2.5% that the actively managed funds charge.
Small midcap portfolios
Any company with a market cap between 3,000 to 20,000 Cr. comes under the small mid cap portfolio category.
There will be some stocks which will be multibaggers and some will fail. As is the nature of portfolio returns, the winners will end up with more than compensating for the losers. This will happen only if the investor buys and leaves the portfolio untouched for a long period of time.
More than 20% returns can be expected from these stocks.
There are two avenues of investments in this category.
1. Mutual Funds (direct scheme route).
2.Good and clean investing approach.
Out of 5,000 stocks 4,500 are small caps. There are a number of hidden gems waiting to be discovered.
The Good And Clean Framework
There are two filters that are run on the whole universe of stocks:
‘Good’: helps in identifying stocks that have done a great job in creating shareholder value—right from judicious capital expenditure to profitability to return of surplus cash to shareholders.
‘Clean’: helps in identifying how good the company’s corporate governance is and what the quality of their published accounts is. It is a measure of the long-term sustainability of a company and its performance.
The focus on ‘good’ helps generate the upside while not compromising on ‘clean’ reduces the downside risk.
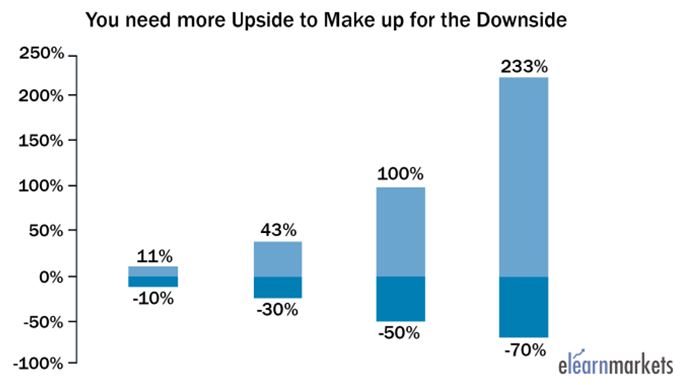
The amount of upside needed to make up for the down side.
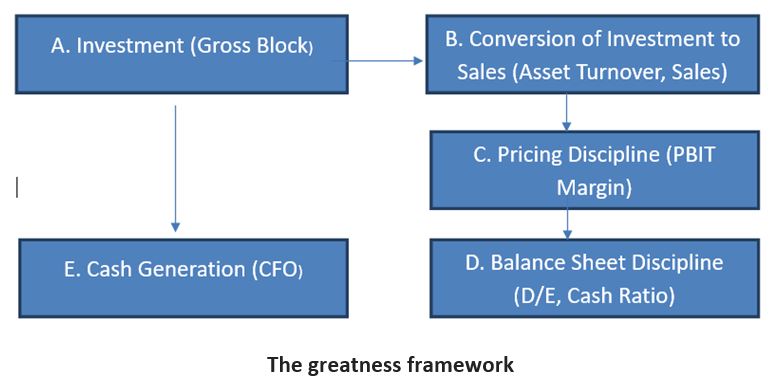
The ‘good’ framework essentially hinges on using publicly available historical data to assess which firms have, over a sustained period of time, been able to relentlessly and consistently:
- Invest capital.
- Turn investment into sales.
- Turn sales into profit.
- Turn profit into balance sheet strength.
- Turn all of that into free cash flow.
- Invest free cash flows again.
The Greatness Factor.
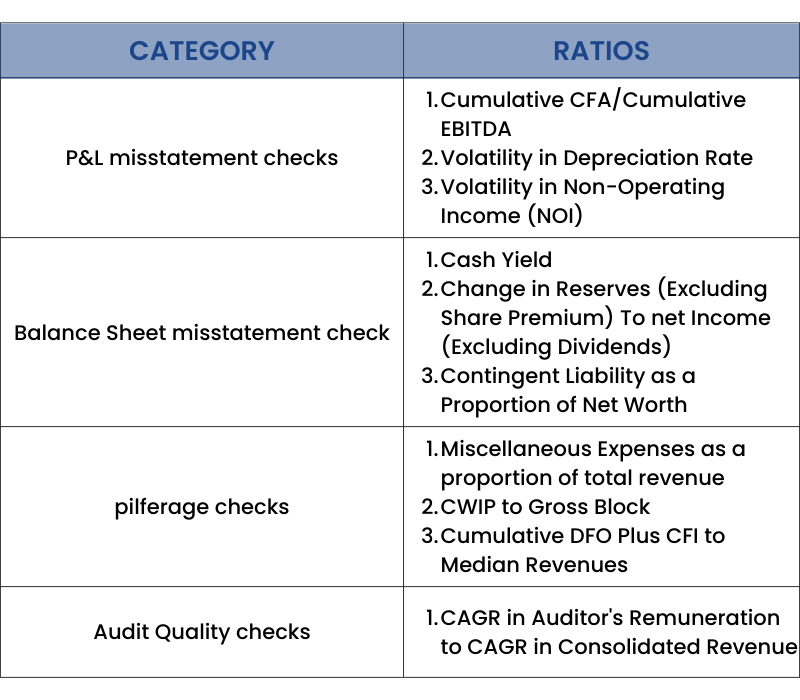
Clean: The accounting Framework checks for the quality of companies' accounts using 11 ratios
Importance of the cleanliness check - If we rate the BSE 500 companies on the basis of cleanliness and divide them into 10 groups, data shows that the company with the worst scores i.e. the least clean companies, gave the worst return to shareholders.
Therefore, ideal equity allocation should be:
1.20% Nifty tracker
2.20% Coffee Can Portfolio
3.20% small cap mutual funds
4.And 20% good and clean investing
Debt Allocation
The author explains that Debt was like the non-striker in a batting partnership, somebody who will hold the other end whilst the big hitting and runs will be scored by the striker, which is equity in this case. It is a no-brainer to invest in mutual funds for one’s debt allocation.
While debt Mutual Funds are subject to long term capital gains taxation of 20% with indexation, returns from fixed deposits and bonds are taxed fully at the income tax rate.
Mutual fund effective tax rate comes to be 5 to 15%. If a bond and a fixed deposit both give 9% pre-tax returns, an investor may get only a 6.3 % post tax return with the fixed deposit.
The same investor with the same 9 % pre-tax return can get 8.1 % in a mutual fund (because of what amounts to 10% capital gains taxation). In other words, the investor ends up getting approximately 30 % more on a post-tax basis if he takes the debt fund route.

A debt mutual fund’s return is a function of:
1. Yield to Maturity (YTM)
2. Mark to Market (MTM)
3. Expense Ratio.
Debt Mutual Fund’s Return = YTM + MTM – Expense
There is high inverse correlation between credit score and yield to maturity of debt funds. Choose debt funds on the basis of quality of portfolio rather than the historical returns given by these funds.
High inverse correlation between credit score and yield to maturity of debt funds.


When the required rate of return is higher than Mr. Talwar that is 17.3 percent

Designing Your Own Financial Plan
We have sought to spell out relatively low-risk, high return investment methods throughout this book. The traps you need to avoid both with respect to your life goals and with regard to your financial objectives are stated clearly.
The essential link between your investment style and your financial objective is made through financial planning.
Our income usually stops at retirement whereas expenses continue till we die.
Steps to follow for financial planning:
Step 1: Key in your cash flows
Step 2: Key in your current portfolio and assets
Step 3: Key in your goals
Financial planning is a dynamic exercise and needs to be carried out periodically or whenever any significant change occurs in your cash flow, assets or goals.
Case Study Of Real Coffee Can Portfolios In The Indian Context

Conclusion :
The central theme of the book is the power of compounding, which needs time to show its effectiveness. Many investors have developed cold feet at the first signs of volatility and exited. Only when you stay invested through multiple cycles, will compounding be able to work its Magic for you.
Given the long term tenures of such investments, it is critical to choose only the Highest quality Investments


Etee Bajaj
This document is curated by Etee Bajaj. A BBA (HNRS) Graduate from St. Xaviers College, she has also completed her M.Sc.(Finance) and CFA from ICFAI University, Hyderabad. She takes keen interest in stock markets and believes in Value Investing and Fundamental research and considers the storyline of a company a crucial factor in investment. Reading autobiographies of renowned people is her hobby.