Elearnmarkets - Financial Market Learning
  • Courses
  • Webinars
  • Stories
  • Language
    • English
    • Hindi
    • Bengali
No Result
View All Result
Get Free Course
  • Basic Finance
  • Derivatives
    • Futures
    • Options
  • Financial Planning
  • Fundamental Analysis
  • Technical Analysis
  • Mutual Funds
  • Marketshala
  • Miscellaneous
Elearnmarkets - Learn Stock Market, trading, investing for Free
  • Courses
  • Webinars
  • Stories
  • Language
    • English
    • Hindi
    • Bengali
No Result
View All Result
Get Free Course
Elearnmarkets - Learn Stock Market, trading, investing for Free
No Result
View All Result
Home Technical Analysis
Triple candlestick patterns: Understand Three Outside up and Three Outside Down Candlestick Patterns 1

Triple candlestick patterns: Understand Three Outside up and Three Outside Down Candlestick Patterns

Elearnmarkets by Elearnmarkets
April 10, 2024
in Technical Analysis
Reading Time: 7 mins read
0
19.3k
VIEWS
Share on FacebookShare on XShare on WhatsApp

The outside three up/down candlestick patterns are variations of chart candle reversal patterns. They are usually used to indicate a trend reversal. 

The three outside up/down candlestick patterns are distinguished by one white or black candlestick immediately followed by two candlesticks of the opposite hue.

These varieties of the three outside patterns aim to read near-term changes in trader sentiment by leveraging the market’s psychology.

So, in today’s blog will discuss these triple candlestick patterns in detail:

Table Of Contents
  1. What is Three Outside Up Candlestick Pattern?
  2. Formation
  3. What Traders Interpret from a Three Outside Up Pattern
  4. Trading Example
  5. What is Three Outside Down Candlestick Pattern
  6. Formation
  7. What Traders Interpret from a Three Outside Up Pattern
  8. Trading Example
  9. What is 3 outside in candlestick pattern?
  10. What is the 3 gap rule?

What is Three Outside Up Candlestick Pattern?

Three successive candlesticks form the three outside up pattern, which usually appears after a bearish trend. The movement of these candles always indicates whether or not a trend reversal is imminent.

A single bearish candle is followed by two bullish candles to form the pattern. For counter-trend trading tactics to work, accurate detection of this pattern is critical.

Formation

Below is the formation of the Three Outside Up Candlestick Pattern-

Three-Down-Up-16

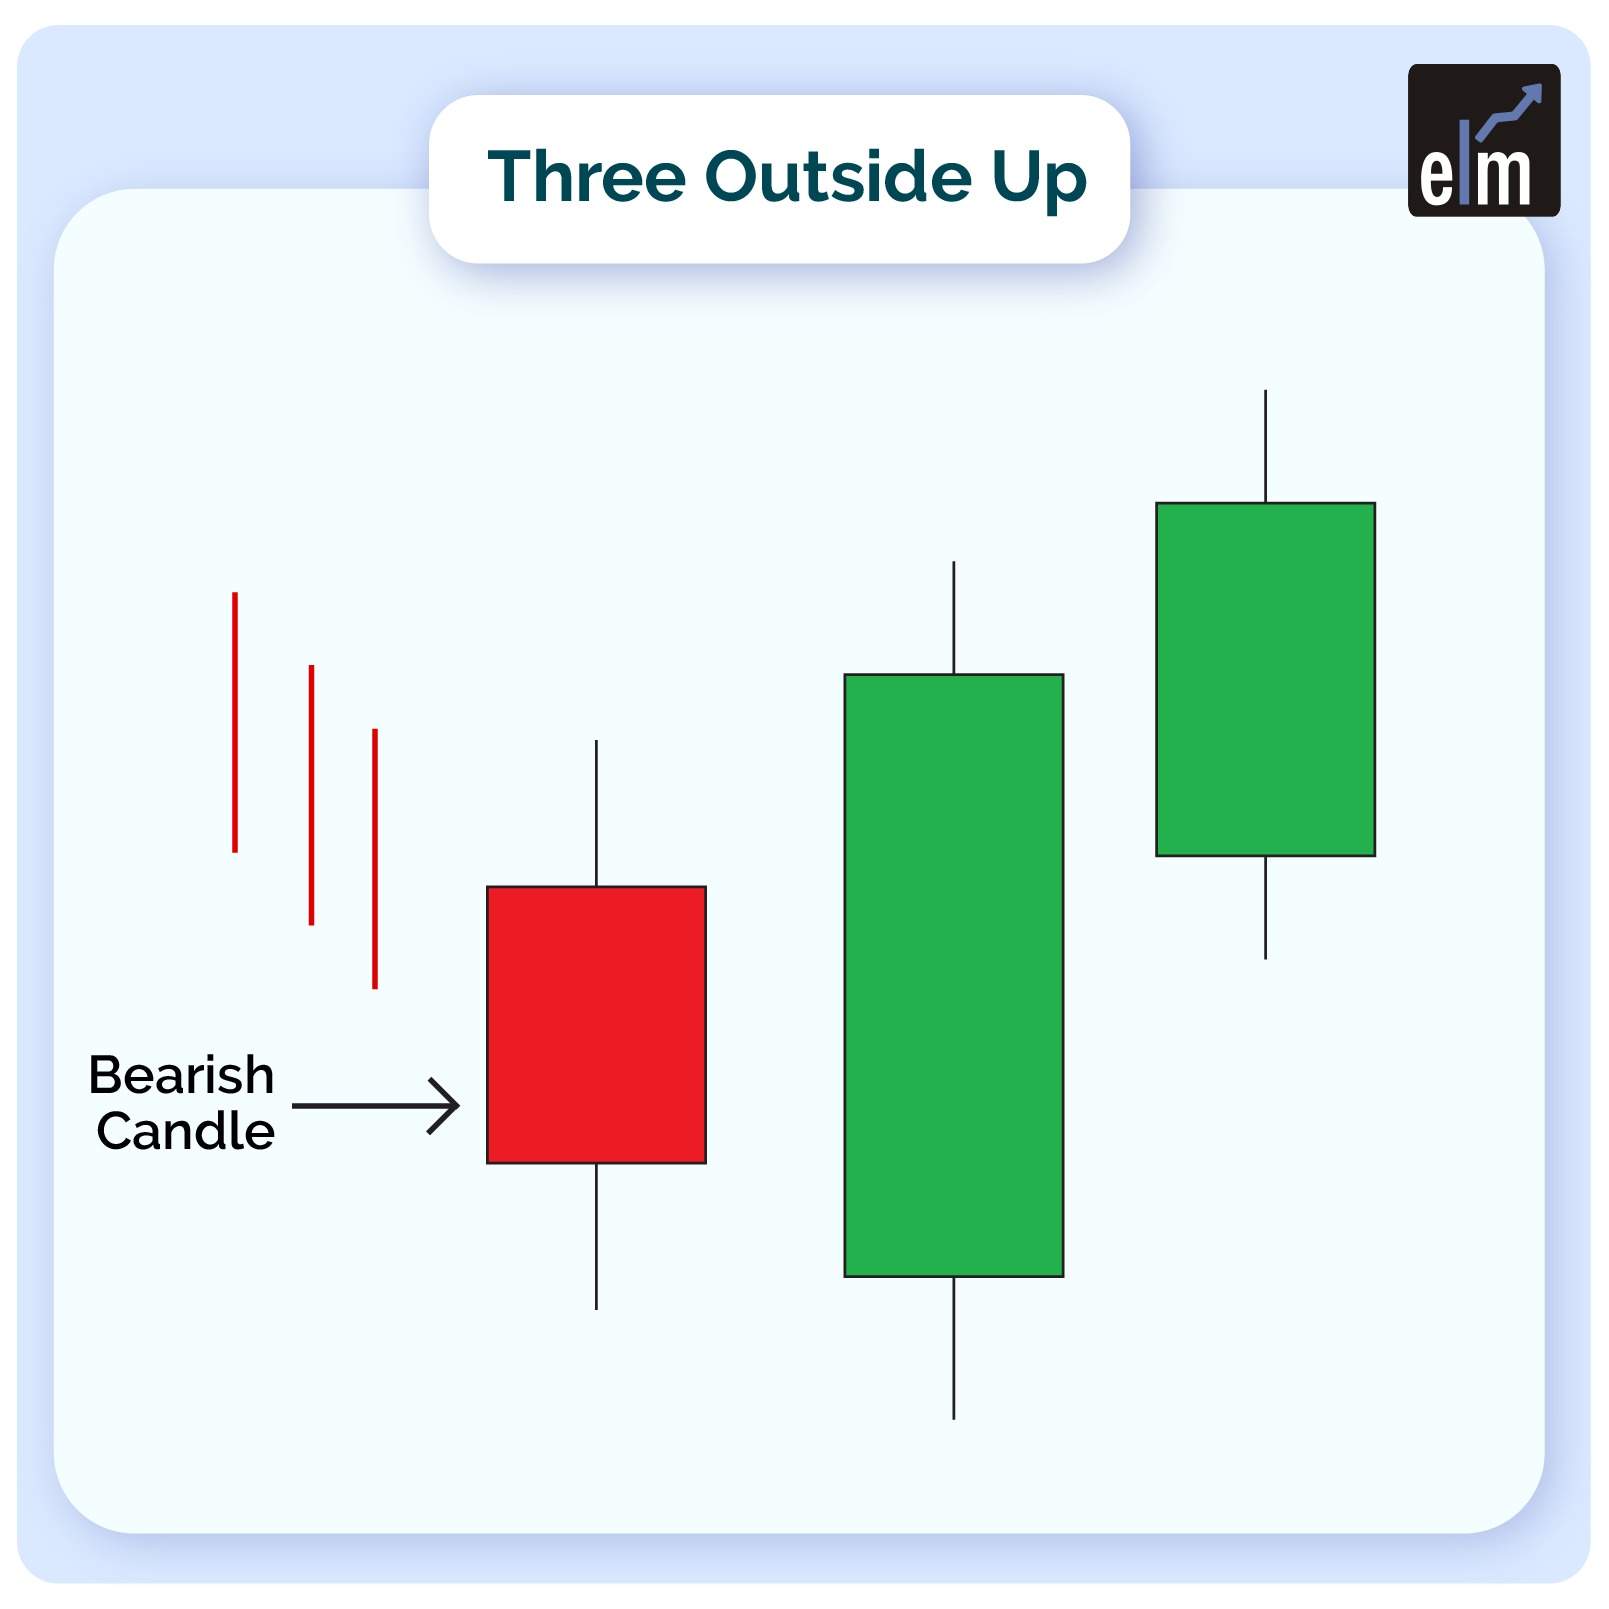
1. The market must decline for a three outside up pattern to appear.

2. The pattern’s first candle will be black, signifying a downward trend.

3. A large white candle will be formed next. It will be long enough for the first black candle to be completely contained within its true body.

4. The third and final candle, which indicates three outside up, must also be white. This candle, however, should close higher than the second candle. This shows that the downward trend is changing direction.

What Traders Interpret from a Three Outside Up Pattern

With the closure lower than the open, the first candle maintains the bearish trend, showing significant selling interest and building bear confidence. 

The second candle begins lower but quickly reverses, crossing through the first tick in a bullish showing. This price action raises a red flag for bears, signalling that those gains should be taken or stopped because a reversal is possible.

The stock continues to rise, with the price now above the first candle’s range, completing a bullish outside day candlestick. This boosts bullish sentiment and triggers buy signals, verified when the security makes a new high on the third candle.

Trading Example

One of the important characteristics of this technical indicator is that the size of the engulfing candlestick, which is the second of three, determines its power. The three outside up patterns is more prominent the larger the second candle. 

engulfing candlestick pattern

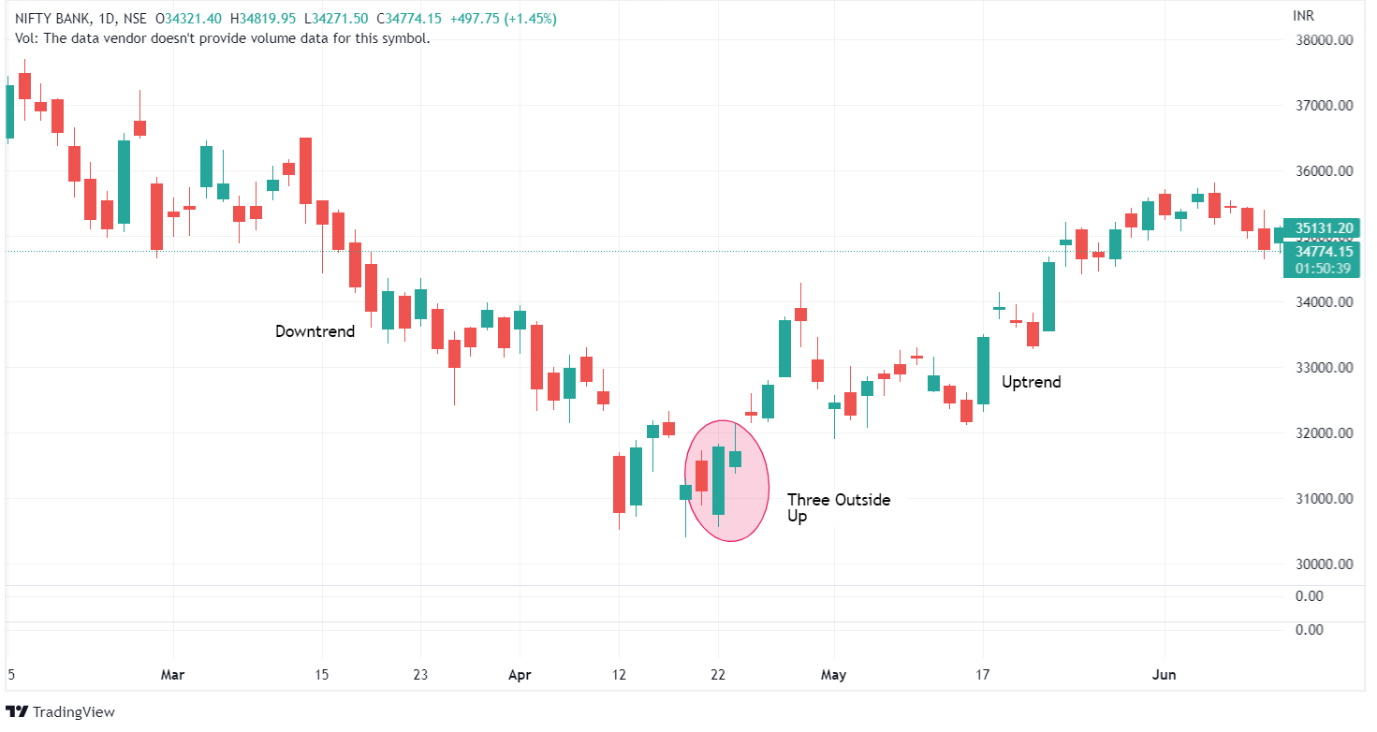
The smaller the negative downtrend becomes, the weaker its indication becomes. As the price movement increases with the second candle, bullish sentiments appear to be outnumbering bearish sentiments.

What is Three Outside Down Candlestick Pattern

Three successive candlesticks form the three outside down pattern, which usually appears during a bullish trend. The movement of these candles always indicates whether or not a trend reversal is imminent.

A single bullish candle is followed by two bearish candles to form the pattern. For counter-trend trading tactics to work, accurate detection of this pattern is critical.

Formation

Below is the formation of the Three Outside Down Candlestick Pattern-

Triple candlestick patterns: Understand Three Outside up and Three Outside Down Candlestick Patterns 2

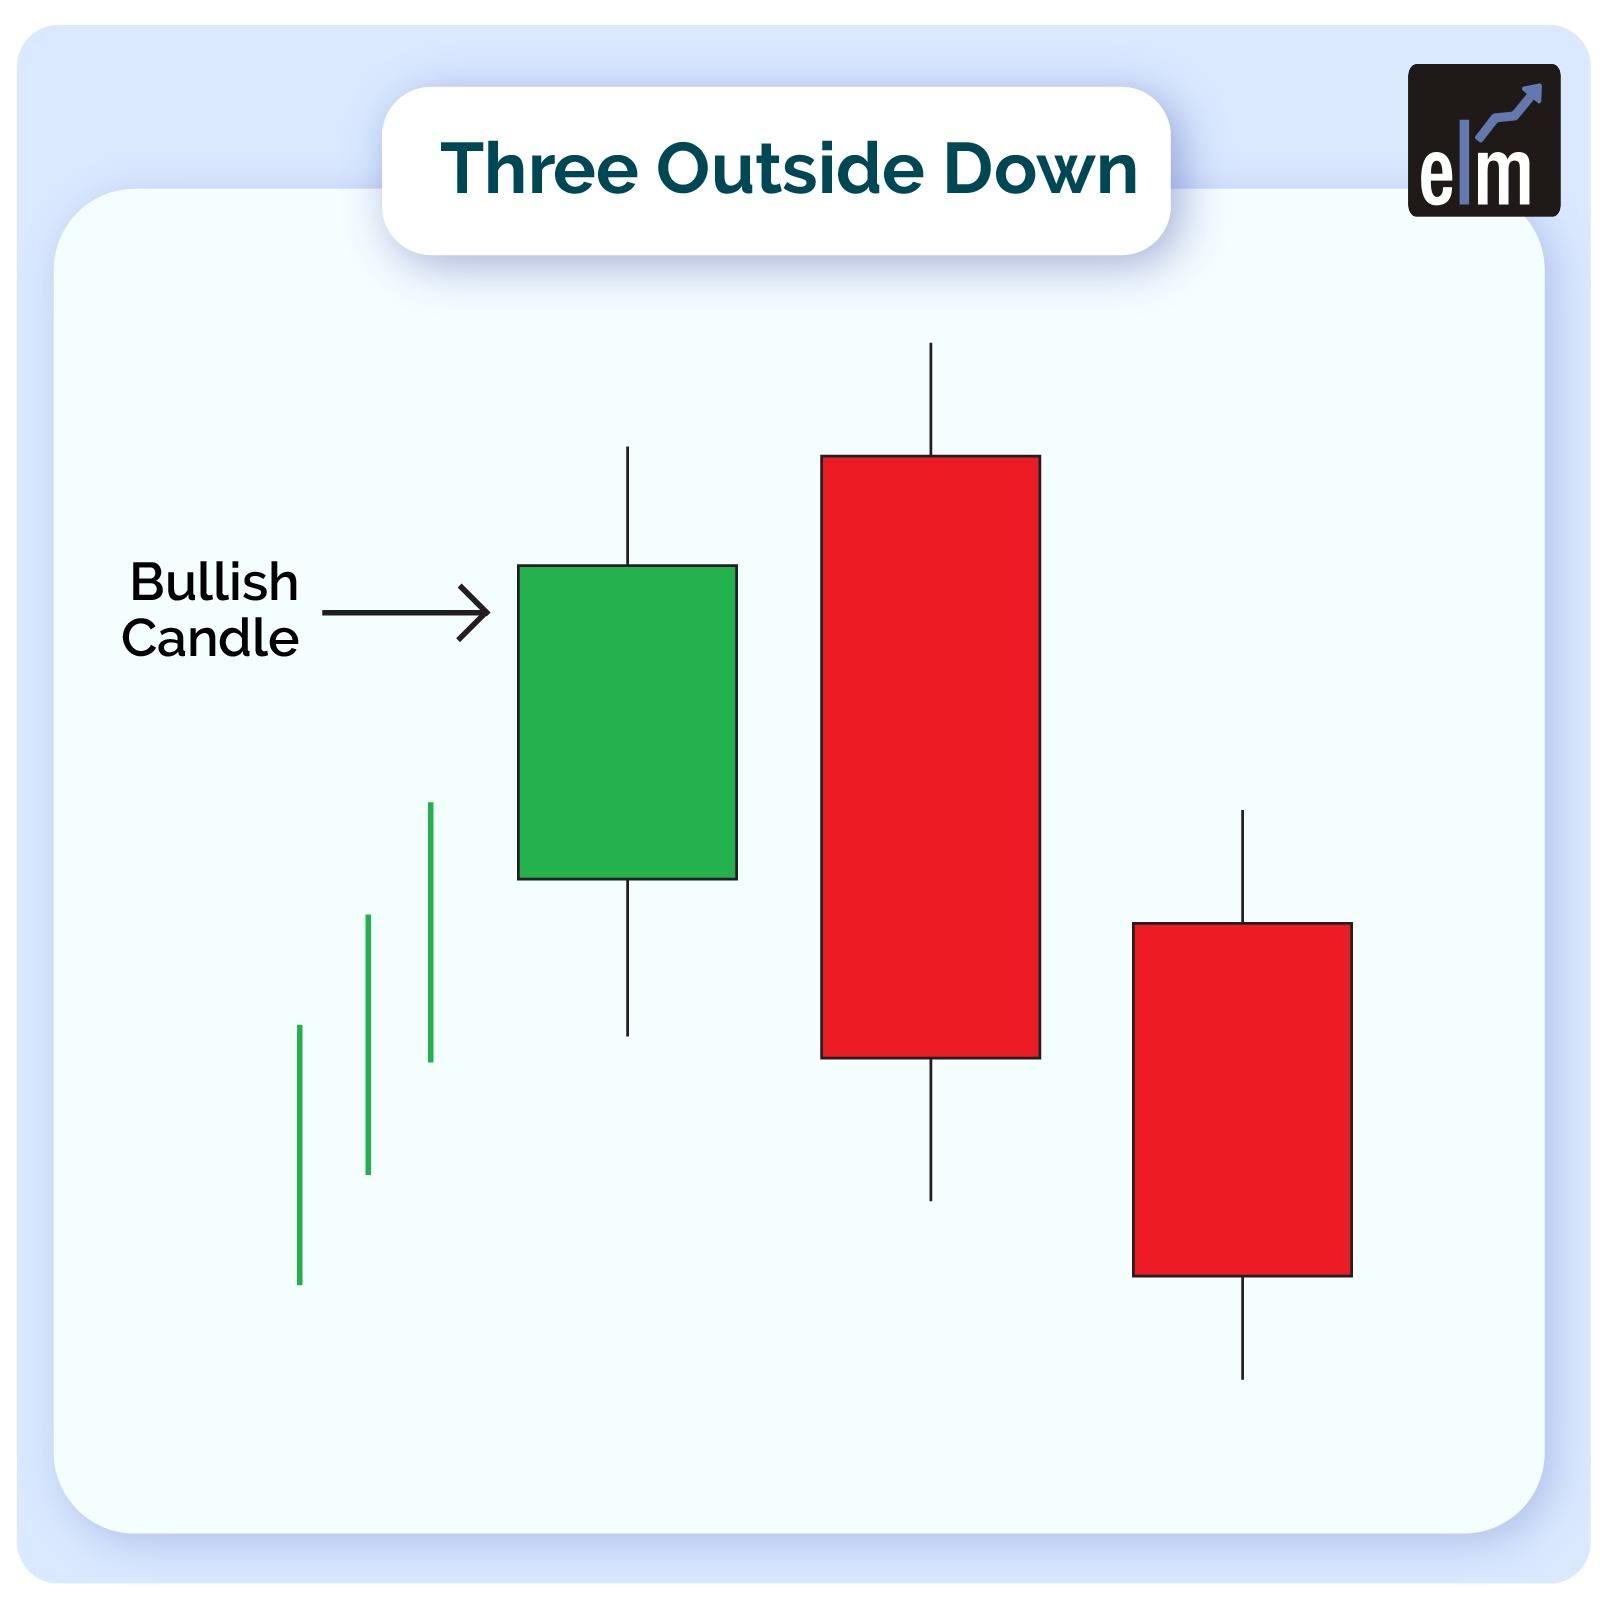
1. The market must be uptrend for a three outside down pattern to appear.

2. The pattern’s first candle will be white, signifying an uptrend.

3. A large black candle will be formed next. It will be long enough for the first white candle to be completely contained within its true body.

4. The third and final candle, which indicates three outside down, must also be black. This candle, however, should close higher than the second candle. This shows that the uptrend is changing direction.

What Traders Interpret from a Three Outside Up Pattern

With the closing higher than the open, the first candle maintains the bullish trend, showing significant buying demand and building bull confidence. 

The second candle rises but quickly reverses, crossing through the starting tick in a bearish showing. This price action signals a red flag for bulls, signalling that gains should be taken or tightened because a reversal is possible.

The asset is still losing money, with its price dropping below the first candle’s range, completing a bearish outside day candlestick. These boosts bear confidence and trigger selling signals, verified when the stock makes a new low on the third candle.

Trading Example

As can be seen, the price is strongly going upward, indicating that the bulls have taken control of the market. As a result, the first candle in the pattern closes favourably, following the trend. 

The body of the candle, on the other hand, stays modest, which could indicate a slowdown in buying enthusiasm. Finally, the second candle opens ‘gap up,’ indicating the bulls’ attempt to push prices farther higher.

three outside up trading example

The purchasing enthusiasm has entirely faded at this time, and the bears have entered the market. This rapid surge of sellers in the market flips the market, causing the price to drop. The bears’ grip on the second session is so strong that the second candle’s closing price is lower than the bullish candle’s initial price. 

Because of the strong selling pressure, the second candle ends up engulfing the first. The bears ramp up the pace in the third session, with the pattern’s last candle ending in the negative zone.

Read More- All 35 Candlestick Chart Patterns in the Stock Market

Bottomline

Reliable predictors of a reversal, the three outside up and three outside down patterns, occur often. While using these indicators as their main buying or selling signals, traders should also keep an eye out for confirmations from other technical indicators or chart patterns.

Frequently Asked Questions (FAQs)

What is 3 outside in candlestick pattern?

A bullish candlestick pattern with the following traits is the three outside up: There is a decline in the market. Bearish is the first candle. With a long genuine body and a bullish outlook, the second candle completely encloses the first candle.

What is the 3 gap rule?

The Rising Three Gaps pattern is created when there are three gaps upward, separated by rising candles, and occurs during an ongoing uptrend. The Falling Three Gaps pattern is created when there are three lower gaps interspersed with decreasing candles during an ongoing downturn.

Tags: basiccandlestick patternenglishtechnical analysisthree outside downthree outside up
ShareTweetSend
Get Kotak Offer Get Kotak Offer Get Kotak Offer
Previous Post

How to Trade with Inverted Hammer: Candlestick Pattern

Next Post

Understanding On-Neck Candlestick Pattern

Elearnmarkets

Elearnmarkets

Elearnmarkets (ELM) is a complete financial market portal where the market experts have taken the onus to spread financial education. ELM constantly experiments with new education methodologies and technologies to make financial education effective, affordable and accessible to all. You can connect with us on Twitter @elearnmarkets.

Related Posts

Understand Slippage in Trading
Technical Analysis

What is Slippage in Trading? Meaning & Examples

March 28, 2025
276
Breakout trading strategies
Technical Analysis

Top 5 Breakout Trading Strategies

March 12, 2025
1k
5 stocks for today
Technical Analysis

5 Stocks to Buy Today That Could Beat the NIFTY in 2025!

May 5, 2025
387
Image describing What is marginal trading facility
Technical Analysis

 What is a Margin Trading Facility? Advantages & Risks

April 4, 2025
656

Leave a Reply Cancel reply

Your email address will not be published. Required fields are marked *

Disclaimer

Elearnmarkets (Kredent InfoEdge Pvt. Ltd.) is a SEBI-registered Research Analyst (RA) entity (SEBI Registration No.: INH300007493). The information provided in this article is for educational and informational purposes only and should not be considered as an offer to buy or sell any securities or investment products.

The stocks, securities, and investment instruments mentioned herein are not recommendations under SEBI (Research Analysts) Regulations, 2014. Readers are advised to conduct their own due diligence and seek independent financial advice before making any investment decisions.

Investments in securities markets are subject to market risks. Please read all related documents carefully before investing. Investing in Equity Shares,
Derivatives, Mutual Funds, or other instruments carry inherent risks, including potential loss of capital. Elearnmarkets (Kredent InfoEdge Pvt. Ltd.) does not provide any guarantee or assurance of returns on any investments. Past performance is not indicative of future performance.

Elearnmarkets Logo

Follow Us

Facebook-f X-twitter Instagram Linkedin-in Youtube Telegram

Register on Elearnmarkets

Continue your financial learning by creating your own account on Elearnmarkets.com

Register Free Account

Download App

Playstore logo
Download on app store

Categories

  • Basic Finance
  • Derivatives
  • Financial Planning
  • Fundamental Analysis
  • Technical Analysis
  • Mutual Funds
  • Miscellaneous

Popular On Elearnmarkets

  • Market Superheroes:
  • Vivek Bajaj
  • Chetan Panchamia
  • Ashish Kyal
  • Premal Parekh
  • Abhijit Paul
  • Jegan
  • Sivakumar Jayachadran
  • Jyoti Budhia
  • Vivek Gadodia
  • Vishal Mehta
  • Piyush Chaudhry
  • Santosh Pasi
  • Gomathi Shankar
  • Market Superheroes:
  • Vivek Bajaj
  • Chetan Panchamia
  • Ashish Kyal
  • Premal Parekh
  • Abhijit Paul
  • Jegan
  • Sivakumar Jayachadran
  • Jyoti Budhia
  • Vivek Gadodia
  • Vishal Mehta
  • Piyush Chaudhry
  • Santosh Pasi
  • Gomathi Shankar
  • Courses:​
  • Options Trading
  • Dow Theory
  • Momentum Trading
  • Stock Investing
  • Harmonic Chart Patterns
  • Algo Trading
  • Elliot Wave Theory
  • Advanced Excel
  • Cryptocurrency
  • NSE Certification Course
  • Courses:​
  • Options Trading
  • Dow Theory
  • Momentum Trading
  • Stock Investing
  • Harmonic Chart Patterns
  • Algo Trading
  • Elliot Wave Theory
  • Advanced Excel
  • Cryptocurrency
  • NSE Certification Course
  • Webinars:
  • Bank Nifty Scalping
  • Intraday Trading Strategies
  • Options Trading Strategies
  • Options selling
  • Price Action
  • Relative Strength
  • Tax Planning
  • Options Buying
  • Growth Stocks
  • Portfolio Management
  • Risk Management
  • Renko Charts
  • Crude Oil
  • Traders Psychology
  • Moving Average
  • Multibagger Stocks
  • Free Learning Modules:
  • Intraday Trading
  • Options Scalping
  • Swing Trading
  • Financial Modelling
  • RSI Indicator
  • Bollinger Bands
  • Pricing of Futures
  • Personal Finance
  • Initial Public Offerings (IPO)
  • Value Investing
  • Technical Indicators
  • Candlesticks
  • Chart Patterns
  • Option Greeks
  • ELSS Funds
  • Banking and Insurance
  • Real Estate
  • Gold
  • Book Summaries:
  • Rich Dad Poor Dad
  • Psychology of Money
  • The Intelligent Investor
  • The Richest Man in Babylon
  • Think and Trade Like a Champion
  • Value Investing and Behavioural Finance
  • Trading in the Zone
  • Learn to Earn
  • Book Summaries:
  • Rich Dad Poor Dad
  • Psychology of Money
  • The Intelligent Investor
  • The Richest Man in Babylon
  • Think and Trade Like a Champion
  • Value Investing and Behavioural Finance
  • Trading in the Zone
  • Learn to Earn
  • Tools:
  • CAGR Calculator
  • SIP Calculator
  • eLearnOptions
  • Future Value Calculator
  • Present Value Calculator
  • Atal Pension Yojana
  • Cost of Delay Calculator
  • Become a Crorepati
  • Tools:
  • CAGR Calculator
  • SIP Calculator
  • eLearnOptions
  • Future Value Calculator
  • Present Value Calculator
  • Atal Pension Yojana
  • Cost of Delay Calculator
  • Become a Crorepati

© 2025 Elearnmarkets. All Rights Reserved

  • Visit Elearnmarkets
  • Courses
  • Webinars
  • Financial Guides
  • Get Free Counselling
  • Visit Elearnmarkets
  • Courses
  • Webinars
  • Financial Guides
  • Get Free Counselling

Download Our App

No Result
View All Result
  • Article Categories
    • Basic Finance
    • Derivatives
    • Financial Planning
    • Fundamental Analysis
    • Technical Analysis
    • ETFs & Mutual Funds
    • Marketshala
    • Miscellaneous
  • Language
    • Hindi
    • Bengali
    • English
  • Courses
  • Webinars
  • Stories
Get Free Course

© 2024 Elearnmarkets All Rights Reserved

A Handbook of Technical Analysis
To start your trading journey as a seasoned technical analyst
Download Guide For FREE
Infinity Plan
Trading Day 2025