
How many of you have heard business channels or analysts saying that the stock just broke out from the specific levels and can give big moves either up or down?
We know that you must have heard this many times if you follow the stock market. So, have you ever wondered what are these breakout stocks and how to trade with them?
Well, breakout trading is used by active investors who wants to take a position within a trend’s early stages. This strategy can indicate the starting point for significant price moves, increase in volatility, and, if managed properly, they can also offer limited downside risk.
So, in today’s blog, let us discuss the 7 steps that you can follow when trading breakout stocks:
What are Breakout Stocks?
Breakout stocks are those shares that move beyond their support or resistance level. A key concept in technical analysis, i.e., breakouts, can indicate that a stock is about to make a major move.
So, if a stock moves above its resistance level, then it will generally go on to make a sustained upward move. If it goes past its support level, then it may go on a bear run.
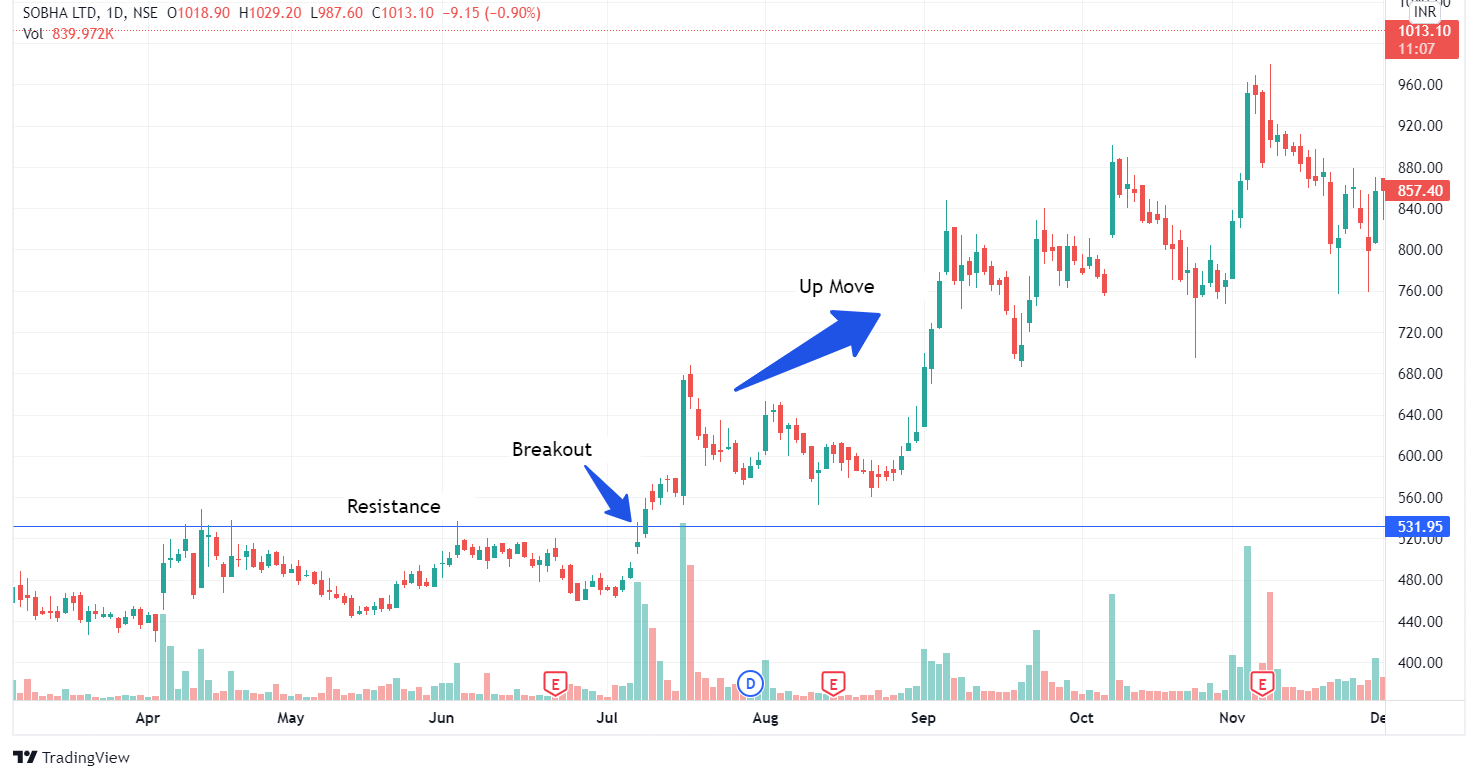
Support and resistance levels are often considered ‘stronger’ if a stock hits them multiple times. In turn, stocks that break through these ‘stronger’ levels often show significant moves.
Stocks are not the only assets which break beyond support and resistance levels. Any financial assets, be it commodities, forex or cryptocurrencies can have breakouts from necessary support and resistance levels.
What are the steps to follow when trading breakout stocks?
Below are the 7 Steps that you can follow when trading breakout stocks:
1. Identify the Breakout Stock Candidate
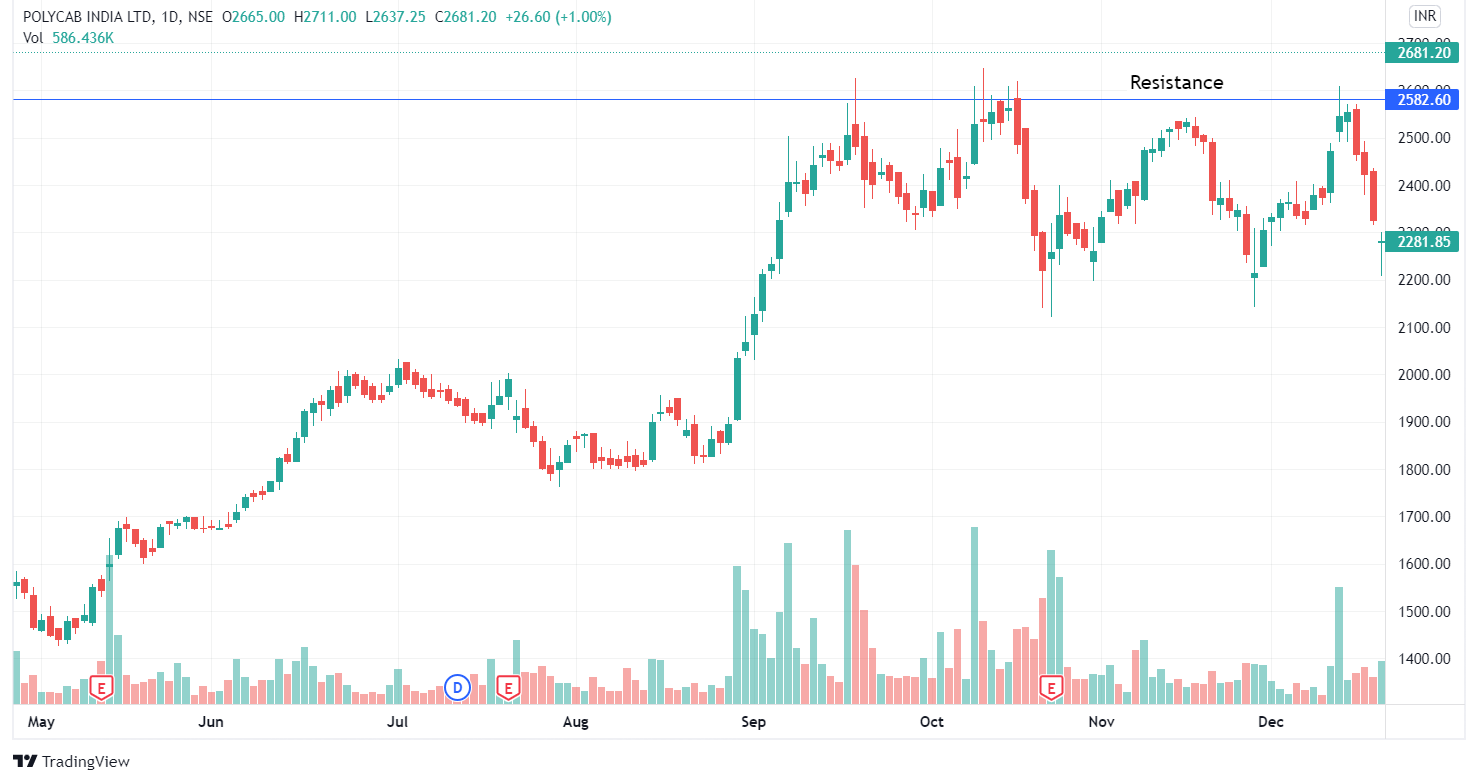
One should find stocks with strong support or resistance levels and keep an eye on them. One should note that the stronger the support and resistance levels, the stronger will be the move from the breakout.
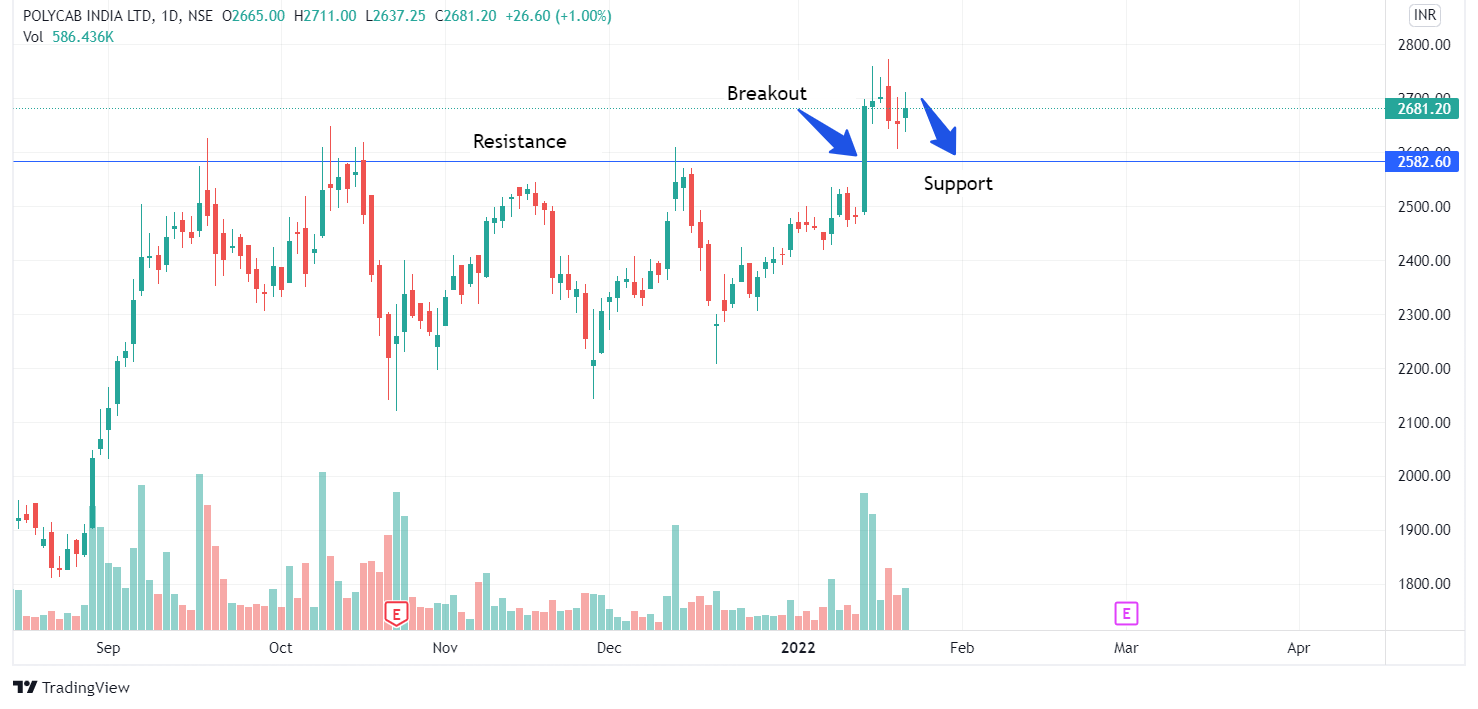
From the chart of Polycab India Ltd. below, we can see how strong the resistance level is as the prices have touched that level 2-3 times.
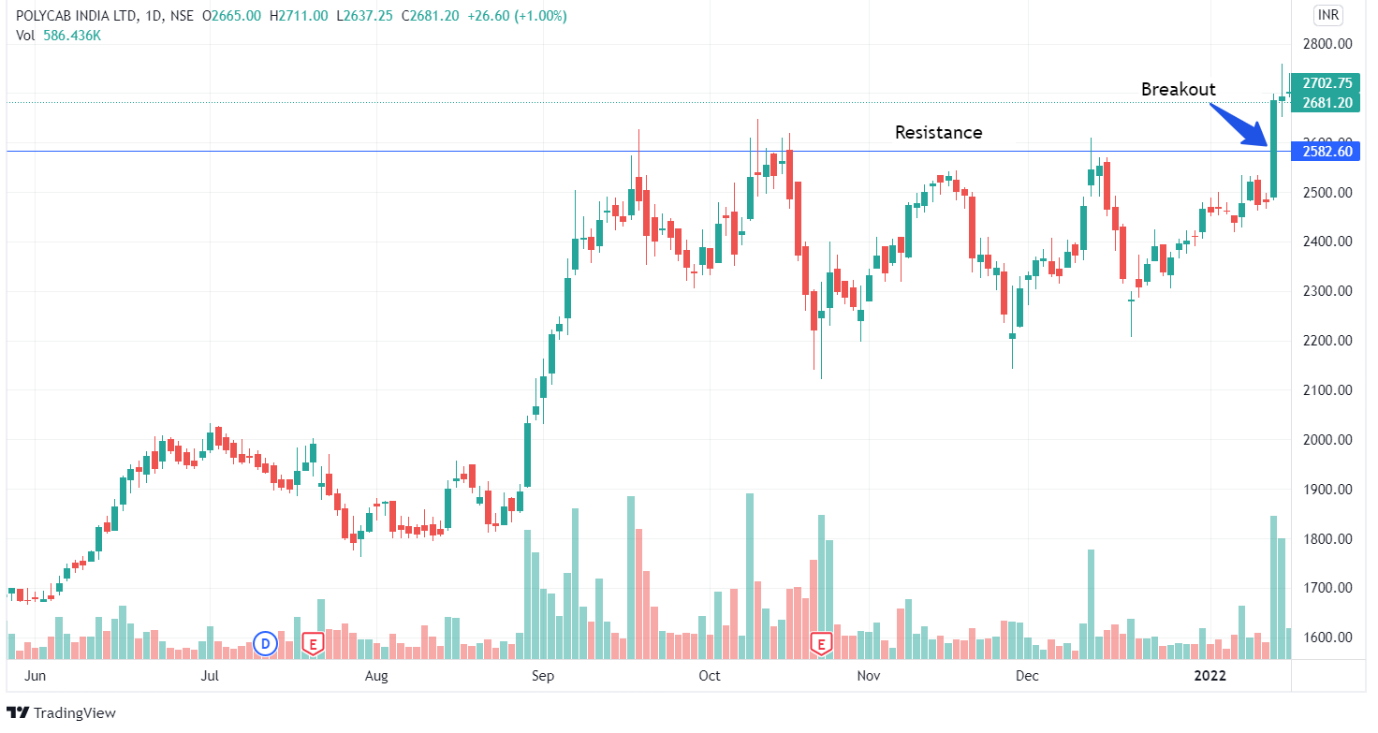
2. Wait for the Breakout
Finding a good stock does not mean that a trade can be taken prior to the breakout. Instead, one should wait patiently for the stock price to move.
Once the breakout occurs on the day the stock price trades outside its support or resistance level, and to be sure that the breakout will hold, one should wait until the closing price to take up the trade as shown below:
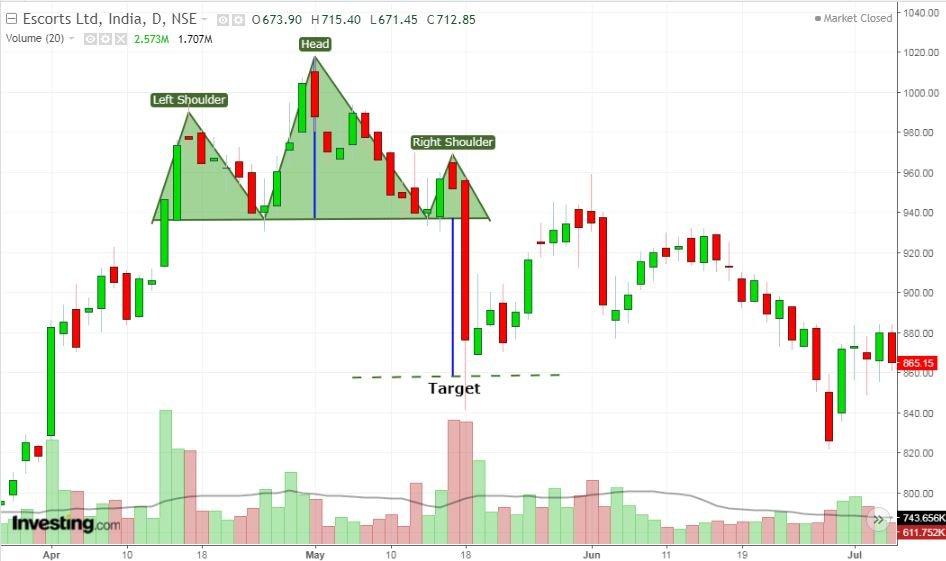
3. Set a Reasonable Objective for Breakout Stocks
If you are going to trade, the breakout stock, then set an expectation of where it will go especially when trading with chart patterns. If you don’t set, you won’t know where to exit the trade.
In the below example the price objective can be set by calculating the distance from the head to the neckline in the head and shoulders pattern as shown below:

4. Allow the Stock to Retest
This is the most important step when trading with breakout stocks.
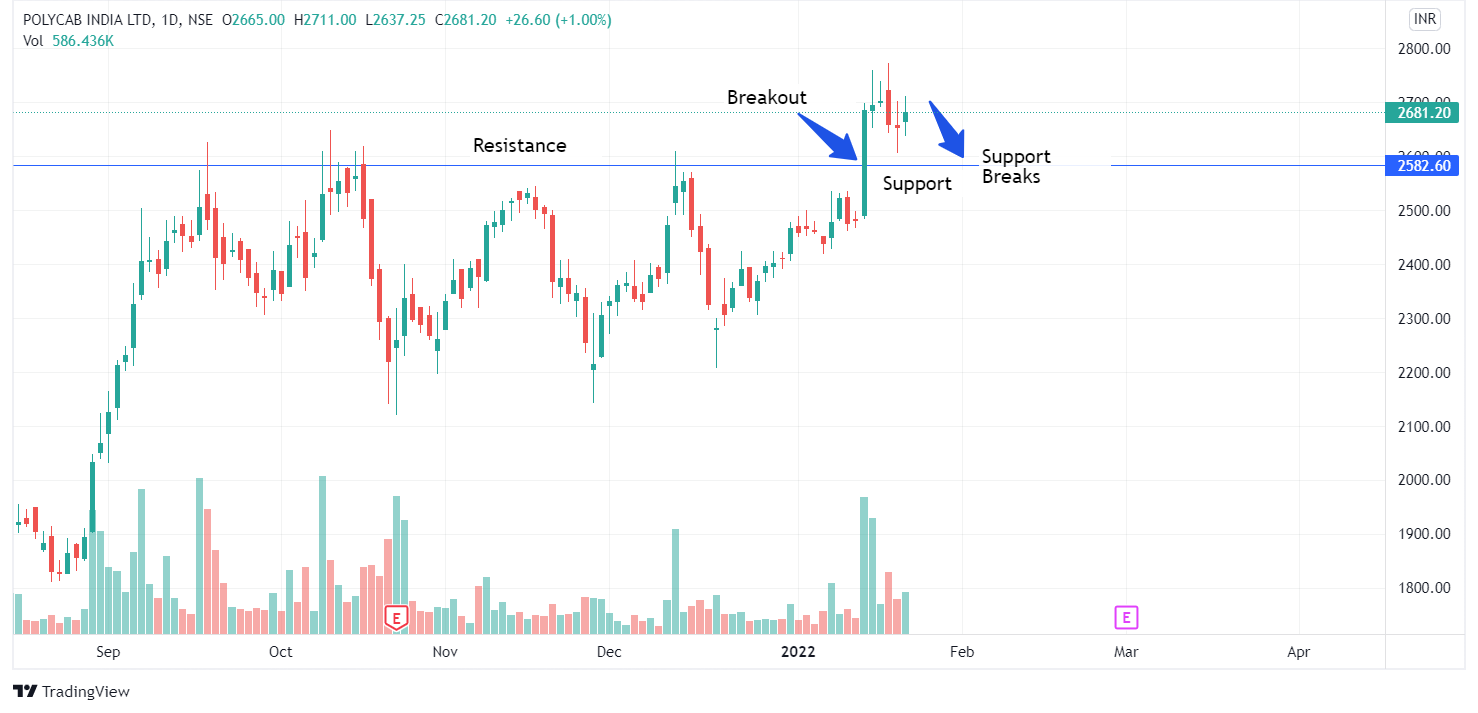
So when a stock price breaks a resistance level, old resistance becomes new support. When a stock breaks a support level, the old support becomes new resistance as shown below:
In the majority of our trades, the stock will usually test the level it has broken after the breakout, so one should be prepared for it.
5. Know When Your Trade/Pattern Has Failed
If the stock retest a prior support or resistance level and breaks back through it, then this is where a pattern or breakout has failed. At this level, you must take the loss. Remember one should not gamble with their loss!
6. Exit Trades Toward the Market Close
One cannot discern at the open if prices hold at a particular level. This is the reason why most traders consider waiting until near the market close to exit a losing trade. If a stock has remained outside a predetermined support or resistance level toward the market close, it is time to close the position and move on to the next.
7. Exit at Your Target
If you are not exiting the trade, this means you are in the trade. One should remain in the trade until the price of the stock reaches its objective or time target without hitting the target price.
You can also read more about Basics of Technical analysis from ELM School
Webinars on Breakout Strategy
You can learn more about breakout strategy from the below webinars:
1. Compression Breakout Strategy by Piyush Chaudhry
The objective of this webinar, Compression Breakout Strategy by Piyush Chaudhry, will help the traders identify high probability swing setups. Understanding the Volatility of the underlying plays an essential role in timing your entry and exits.
2. How To Make Profit Out of Failed Breakouts by Ankit Chaudhary
Breakouts usually occur at designated resistance and support trend lines. So, a Failed breakout occurs when a price moves through a level of support or resistance but does not have enough momentum to maintain its direction.
This is the worst-case scenario for a breakout trader who enters trade as soon as the price breaks out from a pattern. So, in the webinar by Ankit Chaudhary learn How to Make a Profit Out of Failed Breakouts.
3. Multi Timeframe Analysis & Identifying Failed Breakouts by Deepak Thakran
In this webinar Multi Timeframe Analysis & Identifying Failed Breakouts by Deepak Thakran, we will discuss key points that should be taken care of when trying a counter-trend trade. Multi timeframe analysis is a building block for it.
Finding Breakout stocks using StockEdge Edge Reports:
You can also find the list of breakout stocks from the Edge Reports as shown below:

You can also watch the video on Breakout Stocks by Mr Vivek Bajaj
Bottomline
One should note that Stock breakouts occur when a company’s share price moves beyond an area of support or resistance, as we have discussed above. They are mainly used as an indication of a new trend forming.
We hope you found this blog informative and use it to its maximum potential in the practical world. Also, show some love by sharing this blog with your family and friends and helping us in our mission of spreading financial literacy.
Happy Investing!


Please make an article on perfect 2 to 3 combinations scans stock edge for intraday or swing trading of Fno stocks and others. Gaurav. Regards.
Hi,
We really appreciated that you liked our blog! Thank you for your feedback!
Keep Reading!